'Other scenarios regarding how water can reach the lower decks are of course possible. If by us used drawings do not reflect the actual status of the vessel, evidently the conclusions are not valid.'
Frank Rosenius, Staffan Sjöling - 28 March 2003
'Frågan hur Estonia kunde sjunka så snabbt har inte klarlagts i JAIC:s haveriutredning. I en ansats att reparera den bristen gavs SPF uppdraget att framta ett material som med utgångspunkt i haveriutredningens rapport skulle åskådliggöra hur Estonia kan ha vattenfyllts i haveriets slutskede. Med den begränsande premissen utarbetades en förstudie som mer kan ses som en övning i dialektik än ett klargörande av sjunkningsförloppet. I den använda beräkningsmodellen har datorprogrammet manipulerats för att arbeta med antagna men icke verifierade konstruktionsförutsättningar samt belastningar långt utöver vad verkligheten skulle tillåta'.
AgnEf - Arbetsgruppen för utredningav M/S Estonias förlisning - B. Calamnius, ord
FAE - Föreningen Anhöriga Estonia - G. Claesson, ordf.
SEA - Stiftelsen Estoniaoffren och Anhöriga - L. Berglund, ordf. - Stockholm den 9 februari 2005
1.51 Styrelsen för Psykologiskt Försvar - sjunkförloppsstudien mars 2003
This chapter is dedicated to my friends Spiro Pahos - "its up to every one's insight to believe what he reads" and Kenneth Rasmusson - free editor at Lund, Sweden - "Men vem vet? Snart kanske det blir ett uppknytningskalas i gamla Svedala :) Man ska ju som bekant aldrig vara för säker".
(Detta kapitel är skrivet på engelska men svensk översättning kommer så småningom).
On 28 March 2003 the SPF made public the Pre-study how to explain the sinking of the Estonia 1994 based on the alleged facts of the Commission. The government had ordered the original task on 19 April 2001.and the SPF had appointed Staffan Sjöling on 30 September 2002 to carry out the study in 60 hrs (sic), assisted by vice admiral Frank Rosenius. The study should have been ready by 31 December 2002.
The writer has met Rosenius and been in e-mail contact with Sjöling. The message was that it is/was impossible to explain the sinking of the Estonia on 28 September1994 without concluding that the 'lost visor' and the 'water on the car deck' story invented 1994-1997 is false. The writer naively thought that he could convince Rosenius/Sjöling to state that their task was hopeless.
The Estonia Pre-study report was thus filed with the SPF on 28 March 2003 by Sjöling/Rosenius. On 1 April 2003 admiral Rosenius was then appointed head of the office of His Majesty the King (chef för HM Konungens stab).
The Pre-study confirms previous Errors by the Commission
The Pre-study report is very interesting as it demonstrates clearly how the Commission 1994-1997 falsified the stability and floatability calculations of the Estonia accident investigation, as already pointed out in 1.9.
The Pre-study can be read below in its entirety in Swedish and English. The very poor Swedish language (syntax and grammar) used by Sjöling/Rosenius is fairly well reflected in the writer's English translation. Sjöling/Rosenius complain in several places of their limited resources. Nevertheless they produce a sensational document - not one essential piece of information can be underwritten by serious stability experts. You can also down-load the Pre-study (in Swedish) from http://www.psycdef.se/extrafiler/estoniastudie2003.pdf .
According to the written SPF instructions, the actual sequence of sinking was not going to be explained in the Pre-study, only the preconditions how to make such a presentation of the last 22 minutes, i.e. between say 01.30 (80 degrees list) and about 01.50-01.54 hrs (the vessel finally sinks), which had not been explained. The writer thought it was usual delaying action by the SPF. But Sjöling/Rosenius actually explain - or make an attempt to describe - the whole sequence of sinking in their Pre-study - from 01.15 hrs until, say 01.54 hrs. To do so, they have to repeat a lot of past disinformation.
How to explain the Sinking of a Ferry with an undamaged Hull?
Sjöling/Rosenius split the task to explain the sequence of sinking into three separate parts -
(a) the flooding of the superstructure with 0-12.000 tons of water on the car deck - (decks 2 and 3) (no sinking and no capsize as the ferry floats 22 minutes on the deck house (sic) preventing capsize while no water flows out through the wide open bow due to trim), and(b) the flooding of the watertight deck house through some damaged openings; a door, some windows (decks 4 - 9 above the car deck) (still no sinking or capsize as the ferry floats stably on the hull and on undamaged parts of the deck house) and
(c) the flooding of some watertight hull (engine) compartments (decks 0 and 1 below the car deck), the latter so that the vessel actually sinks - suddenly.
Maritime experts concerned with the Estonia sinking has wondered about
(a) how the ferry could load 0-12.000 tons of water in the superstructure without immediate capsize with only 2 000 tons of water in the side and
(b) why wasn't the deckhouse above the superstructure immediately filled with water, when it was submerged and how could it be considered watertight? and
(c) how could the intact, watertight hull compartments below the car deck be flooded with water? and
(d) why didn't the water in the superstructure flow out, when the ship stopped after a few minutes?
Water Filling of the Superstructure above the Water Line - no water flows out
Sjöling/Rosenius apparently assume - Attachment 1 of the Pre-study - that first the superstructure (the car deck space) was water filled at a rate of 300-1 800 tons/min based on info in the Final report (5) 12.6.2. However, 12.6.2 does not say so. It assumes 300-600 t/min inflow the first few minutes - until 20° list is developed. It further assumes that totally only 1 800 tons have flowed in when the list is 35° after 8 minutes, i.e. average inflow was only 225 tons/min. and that the ship then had stopped. The figure 1 800 tons/min seems to come from this author in Appendix 4 - the ship capsizes after one minute. So here the Pre-study does not follow the Final report.
And neither Final report nor Pre-study asks the question - why didn't the water flow out, when the ship had turned after 5 minutes and the bow was away from the waves? At that time you would expect all water inside the superstructure to flow out!
Furthermore, JAIC/Huss suggested elsewhere that the water inflow into the superstructure was only 38,5 - 55,6 ton/min after the accident Table 1.9.2. How can a ship sink if the inflow - into a superstructure above waterline! - is so small? Why doesn't the water flow out through the opening in the bow, when the vessel has turned East and the opening is away from oncoming waves? The journalist Anders Hellberg of the biggest Swedish daily Dagens Nyheter reported that 2 100 tons entered in six minutes. It is 350 tons/minute. Sjöling/Rosenius do not consider any information given by the Commission in the Final report chapter 12.6 about simulations of the water filling 1.21.
The JAIC scenario is simply the following events, fig 13.2 in Final report (5). That figure is a 100% falsification - there is no evidence for anything positions, speeds, courses, angles of list, etc. Everything is just invented as described below:
1. At 01.14 hrs the weather tight bow ramp in the superstructure is fully open (the visor has fallen off and pulled out the ramp). Speed >14 knots straight into the waves. The opening is about 5,4 m wide and 6 m high and the ramp is down to the waterline. Water enters only into the superstructure onto deck 2, when the bow dips into the waves and the ramp assists the water to flow up into the superstructure, where it collects in the side of the superstructure. Course 281°. The ship is of course still floating on the hull and starts to list slowly due to water inside the superstructure. There is no evidence that this happened. Testimonies of the crew suggests that the ramp was still closed two minutes after the first heeling over to starboard.2. At 01.15 hrs - while slowing down - the list becomes 15° due to a certain amount of water in the superstructure on deck 2 - no water flows down in the stairwells down into the hull. The stairwells are far away from the water in the side. Course 281°. Distance sailed since event 1 is 0.25 NM. Ship is still floating. As stated above crew testimonies reported the superstructure dry at this time.
3. At 01.16 hrs - speed 9 knots - the list is still 15° (the water inflow had temporarily stopped (sic)). Course 261°. The ship starts a 180° turn. Distance since event 2 is 0.17 NM. A lot of 'fragments' fall off the ferry, which should prove the turn according to JAIC. Why these 'fragments' fell off is not clear.
4. At 01.20 hrs - speed 6 knots - list is now 30° due to 1 000 tons of alleged water in the superstructure on the bulkhead deck (see suppl. 522 of Final report (5)) - thus the inflow into the superstructure was only about 167 ton/minute during 6 minutes. No water is seen flowing down into the stairwells. Course 122°. The port turn is ended. Distance sailed since event 3 is 0.48 NM. At this stage of events you would expect that all water flowed out! The course is 122°, i.e. bow opening does not face any oncoming waves.
5. At 01.22 hrs - speed 4.5 knots - list 35°. Course 140°. Distance since event 4 is 0.2 NM. Ship is still floating. Alarm is raised onboard. As the speed is almost nil and the bow points away from the waves, you would expect that all water flows out of the superstructure, i.e. that the water inflow is negative = water outflow = the vessel list should be reduced, etc. Without any evidence the JAIC suggests the opposite - more water comes in! - and Rosenius/Sjöling just accept that as fact. They suggest that inflow is 300-1 800 tons/minute into the superstructure at this time, which is nonsense.
6. At 01.24 hrs - speed 2.1 knots - list 40°. Course 160°. Distance since event 5 is 0.12 NM. Windows are smashed in deckhouse deck 4. The deck house starts to fill with water (and the new Sjöling/Rosenius assumption is that the engine rooms start to be flooded by 400 tons/min through open ventilation ducts in the side ending just below the deck house - otherwise the ferry will never sink!).
7.1 At 01.30 hrs - speed 1.7 knots - list 60-70°. Course 154°. Distance since event 6 - 0.30 NM.
7.2 At 01.33 hrs there is 1 500 tons of water in the superstructure on deck 2 (see suppl. 522 of Final report (5)) - thus the inflow into the superstructure was only about 38,5 ton/minute during 13 minutes since 01.20 hrs. With 1 500 tons of water loaded in the superstructure the angle of list should only be 32°. Speed is nil! All water should no flow out! The vessel drifts sideways. The list is 75° because there is also water in the deck house: according to the Final report (page 183)"18.000 tons of water onboard distributed between the car deck and decks 4 and 5 would have given a heel angle of 75°", but the intact, watertight deckhouse deck 6 and 7 prevents capsize - the ship floats on the watertight deck house. (Assuming like Sjöling/Rosenius that the engine rooms had been flooded since 01.24 hrs with 400 tons/minute there should now also be 2.800 tons of water in the hull, which would have sunk like a stone, i.e. the sinking stops at 01.33 hrs). But ...
7.3 At 01.35 hrs the list is 80° (figure 13.3 of Final report) - no sinking. The ship still floats on some dry and empty hull compartments somewhere and drifts sideways with 2,2 knots speed.
7.4 At 01.40 hrs the list is 115° (figure 13.3 of Final report) - the vessel is still floating, i.e. the hull is still not fully flooded.
7.5 At 01.42 hrs there is 2 000 tons of water in the superstructure on deck 2 (see suppl. 522 of Final report) - still no sinking - thus the inflow into the superstructure was only about 55,6 ton/minute during 9 minutes since 01.33 hrs. There is no evidence for any of the inflow figures given above. All figures are invented!
8. At 01.52 hrs the ship (suddenly) sinks/disappears. Distance from 7.1 - 0.88 NM (average speed from events 7.1 to 8 is 2.4 knots, i.e. the speed increased after event 7.1).
The sinking position of event 8 is 1 570 m due East of the start position 1. The sudden sinking after 38 minutes is not explained.
The basic question for Sjöling/Rosenius to answer is thus: How did the watertight hull, decks 0 and 1, with 14 watertight compartments, >18 000 m3, fill with water during 28 minutes between, say 01.24 and 01.52 hrs (so the ship sank without capsizing/floating upside down)? Sjöling/Rosenius suggest it was throught illegal or incorrectly installed ventilation ducts in the side of the superstructure leading to the hull compartments but no evidence is given!
Another question is - how could the Estonia drift the way she did - so long, so fast and with constant speed - while being water filled via the ventilation ducts?
Another question is: who made figure 13.3 in (5)?
And why didn't the water inside the superstructure flow out at 01.24 hrs, when the opening in the superstructure was not facing the waves and the speed was zero? Why did only water flow in/up into the superstructure >2 meters above waterline? According to the law of gravity the water should have flowed out.
Sensational Discovery - Ventilation Ducts in the Superstructure Side 8 meters above the Water Line
Sjöling/Rosenius come up with a sensational discovery - they state they have located - on three different ship's drawings ([4] Drawing 590 02/21 - Safety and Fire fighting equipment, [5] Drawing 590 64/1 - Ventilationplan, Blatt 1 and [6] Drawing 590 24/1 - Wagendeckausrüstung) never heard of before - ten ventilation ducts in the ship's side leading down into watertight hull engine compartments from the deck house.
They obviously make reservations in the Pre-study about the existence of the alleged ducts and the whole Pre-study is nonsense without the ducts; nobody including the Finnish, Swedish and Estonian maritime administrations and the JAIC 1994-1997 has ever heard about the ducts before, they are not shown on the General Arrangement plan of the ship or any drawings officially kept by the Finnish or Estonian administrations or the BV Class society, normally the hull engine compartments are ventilated via the funnel and the engine casing/uptake with the fans/fire dampers located in the funnel, normally you do not fit A-60 insulated ventilation ducts to hull spaces in the side of the superstructure, etc.
Incorrect Ventilation Ducts
The origin of the newly found drawings by the SPF is apparently the Finnish Maritime Administration. If the drawings are correct and they are not, they prove that the 'Estonia' was incorrectly built 1979-1980 by the Meyer shipyard at Papenburg, Germany, and badly approved and certified by the Finnish Maritime Administration, 1980, and incompetently checked at Port State Controls by the Swedish Maritime Administration, 1980-1994 and, again, incorrectly surveyed and certified by the Estonian Maritime Administration and Bureau Veritas, 1993-1994. The reason is simply that the ventilation ducts and openings are 100% in contradiction with the 1966 Load Line Convention. You cannot fit ventilation ducts to compartments below the freeboard deck, e.g. engine rooms with openings without watertight closing appliances in the side of a ship superstructure. Any ventilators must be fitted at least on top of the superstructure deck, with a high coaming and with external means to be closed in case of fire, etc.
|
Normal practice is that ventilation of machinery spaces and emergency generator room, in order to satisfactorily ensure, in all weather conditions (i) the continuous ventilation of machinery spaces, and (ii), when necessary, the immediate ventilation of the emergency generator room, that the ventilators serving such spaces have openings so located that they do not require closing appliances except fire dampers, i.e. that they are installed at the centerline with the coamings extend for more than 4,5 m above the deck in position 1 (0.25L forward part of deck 4) or 2,3 m above the deck in position 2 (0.75L aft part above the superstructure; deck 4 in the case of the Estonia). The safe location of any ventilation openings is at deck 6 - not below deck 4 in the side. Evidently no ventilation ducts were originally fitted in the side of the Estonia to ventilate the engine rooms, as it was done via the casing and the funnel. |
|
The Origin of the strange Drawings
The reader should now be very curious about these drawings; [4] Drawing 590 02/21 - Safety and Fire fighting equipment, [5] Drawing 590 64/1 - Ventilationplan, Blatt 1 and [6] Drawing 590 24/1 - Wagendeckausrüstung suggesting ducts in the side down to the engine rooms.
Where do they come from as the shipyard evidently has not produced them?
|
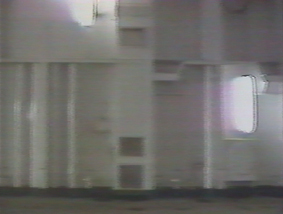
It is very easy to prove that the alleged drawings are false - just ask for the originals from the Meyer shipyard! The shipyard (Mr Hummel) has informed that no such ducts exist. However, there is a possibility that the original ventilation of some hull compartments were found deficient and that the ventilation outlets were modified later. The drawings may be a 'proposal' of one type of modifications but later some other modifications were done. Regardless - the modified arrangement was illegal. It would appear on the other hand that some openings in the side were used to ventilate the superstructure/car deck space outlined above and as seen on the photo right of the interior of the 'Estonia' car deck; you see the duct (beside the pilot door) with opening grids at deck 2 and 3 levels. It seems that the ventilation idea was to extract air via fans on deck 4 aft and allow air inlet through ducts in side - as shown - with an external opening below deck 4 - without any closing devices. It is a stupid arrangement - in case of fire in the superstructure, it cannot be sealed off. The closing arrangement of the inlets in the side must be fitted on deck 4 outside the car deck space. |
|
Sjöling and Rosenius and the strange Drawings
Sjöling/Rosenius assume that the drawings are true and correct and that ventilation ducts exist in the side between deck 4 and the hull compartments (they ignore the ducts between the outside and the cardeck!) - and that the watertight hull compartments were conveniently flooded through them - and that is why the Estonia sank. The hull on which she floated was flooded through ventilation ducts in the side! Finally we are told why the Estonia sank without capsizing. Because Sjöling/Rosenius confirm that otherwise, with water in the superstructure, the Estonia would have capsized
There are allegedly according Sjöling/Rosenius at least ten ventilation ducts in the sides leading down to six watertight hull compartments Attachment 3 of the Pre-study and below table (and none to the car deck):
Number
Frame
Space
V21
26
Store room
V22
37
Store room
V23
46
Store room
V24
49
Store
V25
64
Main engine room
V26
65
Main engine room
V27
55
Main engine room
V28
80
Engine workshop
V29
A
Engine workshop
V210
94
Sewage tank room
Table 1.51.1 Alleged 10 off vent ducts in side from below deck 2 to just below deck 4.
These ducts of small cross areas must be fitted with external A60 fire insulation and in addition be fitted with weathertight (sic) fire dampers at deck 2 or at deck 4 level. In the latter case the duct must be of substantial thickness. If such ducts existed they were stupid and illegal - how to maintain and overhaul a weathertight fire damper inside a fire insulated duct? It was much easier to ventilate the store rooms, workshop and sewage tank room from the central casing and the engine room from the funnel/engine casing/uptake and this is how it should have been done. Why retrofit ventilation exhaust ducts from store rooms, workshops and sewage tank rooms in the side through the superstructure and car deck space?
We should however not worry too much about these new ducts, which will not be submerged until the list is >40° when there are substantial amounts of water on the car deck according to the Commission. The Pre-study is very descriptive about the water in the superstructure on the car deck - and confirms that the Final report is false! Because a ferry does not float upright with water loaded in the superstructure on the car deck - deck 2! The Estonia evidently capsizes before water starts to flow down into the hull compartments through any small cross area ventilation exhaust ducts in the side unless he water flows out of the superstructure. However, more realistically the Estonia should never have capsized in the given scenario with very little water inflow - all water should have flowed out, when the vessel stopped, before capsize could have occurred.
Water on the Car Deck - Capsize
Attachment 5 - Loading condition with water on the car deck, C0-C31, - of the Pre-study clearly demonstrates the original falsifications about water on the car deck. Sjöling/Rosenius suggest that the Estonia would only list 0-55 degrees sideways with 0-12.000 tons of water on the car deck and that the moving water - up to 12.000 tons - will not trim, capsize or sink the vessel - or flow out!
This is not possible! It is impossible to load 12 000 tons of water in the superstructure of a ship with deadweight about 3 300 tons or probably only 3 000 tons of which 2 200 tons is already used.
Furthermore any free water on the car deck moves to the lowest point and trims (rotates longitudinally!) the ship; e.g. 10.000 tons (sic - an enormous free moving weight = to the original weight of the ferry!) forward trims the ship 10 meters on the bow; the ship will fall/roll over forward (actually all water in the superstructure would flow out, but realistically the ship would have capsized sideways and floated upside down before that with only 1 900 tons inside the superstructure = the absolute limit) and turns like a turtle and floats upside down after one minute. Alternatively the ferry trims on the stern and then the bow opening becomes 5-10 meters above waterline. And then - how would water enter through the bow? Therefore the JAIC decided (it is an essential part of the falsifications of all events) that the Estonia didn't trim a centimeter due to the continuous inflow of water (no outflow) on the car deck into the superstructure and the bow ramp was always a little above water (sic! - Attachment 7.2 and Attachment 10 and starboard inflow point WOS of the bow opening and all conditions C0-C31) and Sjöling/Rosenius do not contradict them in their 60 hours of Pre-study.
Limited Deadweight, limited floating Buoyancy
Everybody concerned with ferry stability/loading/floatability knows that any roro-passenger ferry type Estonia has a certain limiting, intact load carrying capacity - the dead weight - say 3 345 tons. The ferry cannot load more cargo, as it will then not survive the risk of two compartments collision damage/flooding of the hull. Two compartments collision damage of the hull and flooding of two watertight compartments of the hull corresponds to the loading of about - maximum 2 000 tons - extra cargo on the car deck of an intact ship. After that, i.e. flooding of more than two compartments of the hull, the watertight hull becomes submerged below water - and sinks. Therefore the loading conditions C8-C31 in Attachment 5 of the Pre-study with 0-12.000 tons loaded in the superstructure are an incorrect assumption or a plain invention.
The Estonia will never survive any of the conditions C8-C31 for the simple reason that she cannot load 2.000 - 12.000 ton water on the car deck as assumed by the JAIC 1994-1997 and Sjöling/Rosenius in 2003. In reality the 'Estonia' would have capsized sideways and up side down long before that with only 1.900 tons of water on the car deck. To use conditions C8-C31 in a Pre-study to demonstrate the sinking of the Estonia is incorrect. It is unscientific!
Thousands of Tons of Water on the Car Deck do not trim the Estonia
And it is here that the scam becomes revealing. In order to hide the fact that the water on the car deck trims, capsizes and sinks the vessel, the originators of loading conditions C8-C31 manipulates the calculation;
(a) the water in the superstructure becomes fixed (like ice!) and does not move or flow out, it is just added as a fixed weight to confuse the computer software,
(b) there is no trim whatsoever (the ice does not move) unless the trim changes a little on the stern (how is not explained).
(c) in addition - to avoid that the ship then sinks with 12.000 ton extra weight loaded in the open superstructure - the originators of loading conditions C8-C31 suggest that the vessel floats on the watertight deck house!
Magic - the Ferry floats on the Deckhouse for 11-17 Minutes
Everybody concerned with ferry stability/loading/floatability knows that any roro-passenger ferry type Estonia does not float on the deck house. The deck house, > 9 meters above the waterline, presents no water- or weather tightness whatsoever to provide buoyancy or a righting moment to prevent capsizing. The deck house is an open structure without any watertight or even weather tight means. Sjöling/Rosenius apparently know these simple facts, which explain their confused explanations of GZ-curves associated with the loading condition, L2, used in the report and confusingly described in Attachment 4 (they try to explain the real facts but then ignore them and simply conclude that the deckhouse is 100% watertight).
Falsified GZ-curves
Any ship has only one basic GZ-curve, which may be reduced in extent if a part originally considered providing buoyancy, e.g. a superstructure, is being open to the sea, e.g. the bow ramp is open. The open deck house is not considered in the GZ-curve. GZ is the righting arm at different angles of list of the ship.
And this is the second part of the original Estonia falsifications (see chapter 12.6.1 of the Final Report (5)) repeated in the Pre-study. Sjöling/Rosenius not only suggest that the superstructure (open at the bow) and deck house decks 4-8 are 100% watertight, they propose that the only way for the ship to sink is that the deckhouse is flooded through some defined inflow openings, e.g. the doors aft used by passengers to walk in and out and, reluctantly, the windows in the sides Attachment 3, even if the difference is small.
Finally they suggest that it takes 11-17 minutes to actually flood the 100% watertight deckhouse - 17 minutes via the doors or 11 minutes via windows+doors.
All this is of course fantasy without factual foundation.
The deckhouses of the Herald of Free Enterprise, the Jan Heweliusz and Le Joola contained no buoyancy and were instantaneously flooded when the ships capsized (and floated upside down) and the Estonia was no different. In the Pre-study calculations Sjöling/Rosenius play God and allow water to flow into the deckhouse (and the hull compartments below) so that the Estonia sinks slowly without capsizing during 11 to 17 minutes.
Blame the Napa Computer Software
In order to play God (or Devil) - and invent (falsify) scenarios how the Estonia sank - Sjöling/Rosenius make reference to Finnish Napa computer software, which they allege can compute the stability and floatability of a ferry during the sinking process. The Napa software is only applicable to floating, generally intact ships with some underwater hull compartments flooded and in communication with the sea after damage - damage stability.
The ship is initially floating on a hull with watertight subdivision and with a weather tight superstructure with certain subdivision (including watertight buoyancy tanks) contributing buoyancy when submerged while, the ship heels. Then certain underwater hull compartments are assumed flooded and the software computes the new floating position, etc. Nothing more, nothing less. A Napa computer cannot be used to show how a ship sinks.
Sjöling/Rosenius modify the Napa program, as Huss, Karppinen and Junnila previously, 1.9 and 3.12, and make initially the whole deckhouse 10 meters above the waterline watertight (sic) hull compartments on which the ship is alleged to float when submerged. This innocent (sic) mistake is the basis of the falsifications.
The Napa program could of course handle 'water loaded on the car deck' in the superstructure - water = <1 000 tons - and would compute a large trim and heel and risk of capsize, which would occur with 1 500 - 2 000 tons. The Napa program could evidently not handle 2 000 - 10 000 tons of water 'loaded' on the car deck. The software would just compute that the ship was lost, had capsized, as it could not load so much!
It is very easy to verify this! Check it on any Napa computer fitted to a Sweden/Finland roro-passenger ferry, e.g. when visiting Stockholm!
The Estonia could not float with 5.000 - 10.000 extra tons of water in the superstructure as the extra buouyancy in the hull to survive two-compartments flooding was only 2 000 tons. This the Estonia conspirators detected already 1995. In order to 'cheat' the software they (a) made the deckhouse watertight and (b) the 'water on the car deck' a solid weight - no trim - balanced by the invented (non-existing) buoyancy in the deckhouse. Rosenius/ Sjöling inherited this stupid and dishonest set-up from the JAIC. And they accpted it. And tried to improve on it! It is quite dishonest. Any scientific model test basin will discover this manipulation.
To slowly fill the Estonia with water Sjöling/Rosenius then opened selected 'inflow openings' to the deckhouse, so it was slowly flooded - and they discovered that the ship would capsize and float upside down. In order to prevent capsize they suggest that decks 7 and 8 are not fully flooded at all and that deck 5 floods before deck 4 (?) and/or then they find ventilation ducts at deck 4 to some hull (sic) compartments and then they allow these hull compartments to flood - so that the ship fills with water. All this is 100% unscientific and 100% dishonest and has nothing to do with naval architecture or seamanship.
Total Time for Sinking - The Estonia sinks 1 000 Meters short of the official Position
Officially - according to the JAIC - the Estonia lost the visor at 01.15 hrs and had about 80 degrees list at 01.30 hrs and later the ship sank at 01.50-01.54 hrs. All the time - regardless of increased enclosed weights - the wreck was drifting at a speed of >2.2 knots. The official task given to the SPF by the government was to clarify the sequence of water filling between 01.30 and 01.50/54 hrs - the last 20-24 minutes (the end of the accident). Sjöling/Rosenius in their Pre-study (attachements 12-15) do not make any attempt to set actual times to their invented events. The attachements 12-15 do not and cannot make any sense.
Regardless, it seems that Sjöling/Rosenius - when they start flooding the deckhouse, which happens at about 01.24 hrs according to the JAIC, cannot stop the ship sinking in longer than 11-17 minutes, i.e. the Estonia sinks already at 01.35 hrs (as suggested by this writer due to hull leakage and visor in place) or 01.41 hrs (suggested by Sjöling/Rosenius).
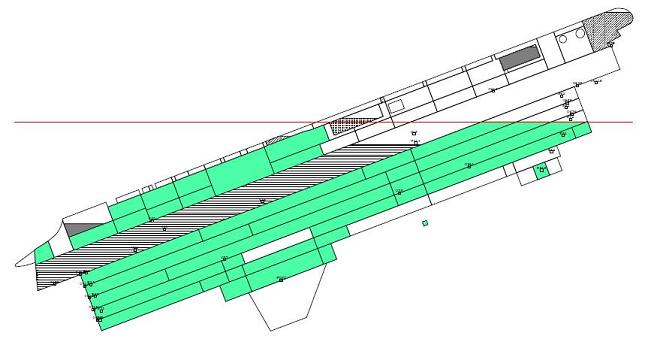
Figure 1.51.3 - Estonia sinks with bow high above water according Sjöling/Rosenius
In neither case the wreck will sink at the official position of the wreck relative the visor at 01.50/54 hrs. So how could the visor be lost 1 560 meters West of the wreck? We are back to the simple conclusion that the official visor position is false, that the visor never detached from the ferry, and that the visor was blown off using explosives by Swedish Navy divers under water after the accident.
The Pre-study written by vice admiral Frank Rosenius and Mr Staffan Sjöling of the Defence Equipment Board (Försvarets Materialverk, FMV) seems to be another tragic - misleading - document in the row of false reports about the Estonia. How can the staff at the Swedish Board of Pyschological Defence accept such a report?
|
E-brev till SPF |
E-mail to the SPF |
|
Beausoleil 6 April 2003 - Er ref SPF Dnr E19/03 Mats Ekdahl - Generaldirektör SPF Vendela Dobson - informatör, SPF Hjärtligt tack för Förstudien av sjunkförloppet + Bilagor 1-15 sända 2003-03-31. Analys av förstudien visar att metoden att simulera sjunkförloppet är fel. Utgångspunkten - Bilaga 5 - lastfall med 0-12.000 ton vatten i överbyggnaden är omöjlig - Estonia kapsejsar och flyter upp/ned redan vid lastfall C7 och kan inte lasta mera vatten, lastfall C8-C31, utan att sjunka direkt. Anledningen tycks vara att output från Napa-datorn beträffande trim helt enkelt har manipulerats. Därför blir alla följande slutsatser i Förstudien och bilagor 6-15 missvisande (förutom att många referenser i Förstudien ej finns redovisade i Bilagorna). Mera uppgifter om brister i Förstudien finns på min hemsida - http://heiwaco.tripod.com/epunkt151.htm . SPF ombedes göra om Förstudien med bättre kvalifierade experter. Vänliga hälsningar Anders Björkman, Heiwa Co |
Beausoleil 6 April 2003 - Your ref SPF Dnr E19/03 Mats Ekdahl - Generaldirektör SPF Vendela Dobson - informatör, SPF Many thanks for the Pre-study of the Sequence of Sinking and Attachments 1-15 sent 2003-03-31. Analysis of the Pre-study shows that the method to simulate the sequence of sinking is wrong. The starting point - Attachment 5 - load conditions with 0-12.000 tons of water in the superstructure is impossile - the Estonia capsizes and floats upside down already in load condition C7 and cannot load more water, conditions C8-C31, without immediate sinking. One reason is that output from the Napa computer re trim simply seems to be manipulated. Therefore all following conclusions of the Pre-study and Attachments 6-15 are misleading (in addition many references in the Pre-study are not shown in the attachments). More errors of the Pre-study are shown at - http://heiwaco.tripod.com/epunkt151.htm . SPF is kindly requested to re-make the Pre-study by better qualified experts. Kind regards Anders Björkman, Heiwa Co |
No reply has been received (18 April 2003)
In January 2004 the SPF (http://www.psycdef.se/estonia/tasks_ongoing.asp) decided to make a computer annimation of the sinking based on the below Pre-study to be presented 1st September 2004 - 10 years after the actual sinking. The SPF and the writers of the Pre-study have ignored all comments by Heiwa Co that the Pre-study is wrong and that therefore evidently also any computer annimation will be wrong. Anyway, the sinking in the Pre-study goes to fast so that the 'Estonia' sinks 1 000 meters West of the actual wreck position. Heiwa Co has 17 March 2004 sent below e-mail to SPF:
|
E-brev till SPF 17 mars 2004 |
E-mail to the SPF 17 March 2004 |
|
Vendela Dobson, Göran Lindmark, Mats Ekdahl - SPF Hej, för er kännedom meddelas att min hemsida finns pà Internet igen http://heiwaco.tripod.com sedan söndags. Redan pà màndag kom ett e-brev fràn birgitta.heijer@economy.ministry.se laddat med ett nytt virus (W38blage.p). Naturligtvis var e-avsändaraddressen falsk. Barnsligt försök att sabotera min dator. Ni ombedes läsa hur Sverige fuskar bort SEK 28 millioner pà sjösäkerhetsforskning 2001-2004 http://heiwaco.tripod.com/vinnova.htm och hur Heiwa Cos ansökningar smusslas bort. Ni ombedes läsa hur Heiwa Cos bevisade uppgifter 2000 om Estonias sjöovärdighet smusslas bort i ett märkligt remissförfarande http://heiwaco.tripod.com/remiss.htm (när ovan Birgitta Heijer tydligen var statssekreteraren som beordrade remissen). Och naturligtvis skall ni läsa om SPFs, er egen, märkliga vattenfyllnadsstudie (för SEK 40,000:-) av Staffan Sjöling pà http://heiwaco.tripod.com/punkt151.htm och jämföra med Heiwa Cos analys http://heiwaco.tripod.com/punkt19.htm . Själv har jag inget med Estoniaolyckan att göra än att jag och mitt företag Heiwa Co analyserar uppgifterna med uppgift att förbättra sjösäkerhet, vilket ni naturligtvis är medvetna om. Nu tycker jag att Sveriges förföljelse av Heiwa Co gàr för làngt. Era uppdragsgivare vet inte skillnad pà sanning och lögn längre eller hur man skall uppföra sig anständigt eller moraliskt i t.ex. sjösäkerhetssammanhang. Vad tycker ni själva? Är det roligt att spela med i den här sörjan längre? Har ni inte eget omdöme? Säg NEJ. Säg att ni inte har lust att arbeta med uppdragen (minnesbank, vattenfyllnad) längre. Säg att ni inte längre tror pà uppdragsgivarnas uttalade, uppriktiga vilja (vad den nu kan vara?). Säg att de kan hitta andra personer (t.ex. HM Konungens stabschef) för att reda upp i sophögen. Läs gärna mitt nya förord http://heiwaco.tripod.com/forord.htm varför jag fortsätter att arbeta med denna märkliga historia. Jag är en lycklig och fri människa men jag tycker inte om att en massa amatörerer med höga titlar i lilla Sveige förlöjligar mitt företag och vad jag uppnàtt i sjösäkerhetssammanhang i IMO och Europa och världen. Ni ombedes därför vänligen att avsäga er fortsatt inblandning med Estonia. Bästa hälsningar Anders Björkman Heiwa Co European Agency for Safety at Sea |
Vendela Dobson, Göran Lindmark, Mats Ekdahl - SPF Greetings, please be advised that my home page http://heiwaco.tripod.com is on the Internet again since last Sunday. On Monday arrived an e-mail from birgitta.heijer@economy.ministry.se loaded with a new virus (W38blage.p). Naturally the address of the sender was false. A childish attempt to sabotage my computer. Your are requested to read how Sweden wastes SEK 28 millions on safety at sea research 2001-2004 http://heiwaco.tripod.com/vinnova.htm and how the Heiwa Co applications are swept under the carpet. You are requested to read how the Heiwa Co proven information 2000 about the Estonia un-seaworthiness was swept under the carpet in a strange internal inquiry http://heiwaco.tripod.com/remiss.htm (when above mentioned Ms Birgitta Heijer was head at the ministry which ordered the inquiry). And naturally shall you read about SPF's, your own, strange water filling study (that cost SEK 40,000:-) by Staffan Sjöling Sjöling at http://heiwaco.tripod.com/punkt151.htm and compare with the Heiwa Co analysis http://heiwaco.tripod.com/punkt19.htm . I have myself nothing to do with the Estonia accident except that my company Heiwa Co analyses the information with objective to improve safety at sea, which you evidently are fully aware of. Now I think that the persecution of Heiwa Co goes too far. Your employers do not know the difference between truths and lies any longer and how to behave correctly or morally with, e.g. safety at sea matters. What do you think yourselves? Is it funny to play along in this mess any longer? Do you not have your own judgement? Inform them that you do not want to continue working with the job (memory bank, water filling). Tell that you do not believe in their wishes (whatever they can be?). Suggest that they can find other persons to clean up this garbage heap (e.g. the head of the office of HM the King). Read my new Foreword http://heiwaco.tripod.com/forord.htm why I continue to work with this strange story. I am a happy and free person but I do not like that a number of amateurs with high titles in little Sweden ridicule my company and what I have achieved concerning safety at sea at the IMO and in Europe and in the world. You are kindly asked to resign from further involvement with the Estonia. Best regards Anders Björkman Heiwa Co European Agency for Safety at Sea |
No reply has been received (10 April 2004).
The Computer Animation is stopped (SPF ref. 2004-04-26 Dnr SPF E 28/04) Request for an independent Investigation
Pro Memoria made at meeting with the Estonia
project reference group 26 April 2004 Present: Mats Ekdahl, chairman, Vendela Dobson
Andersson, Göran Lindmark, Disa Byman, Michael
Öun, Allan Sooman, Frank Rosenius, Brett
Hardman, Birger Stensköld, Magnus
Faxén, Anna Carin Wallenstein, Lasse
Johnsen, Odd Lundkvist, Hans Landberg och Daniel
Westman ... Letter from SEA, AgnEf, FAE and
Vilhelminagruppen Above mentioned associations of relatives have
in a letter to SPF of 30 March 2004 among other
matters demanded that the so called Pre-study, how
to explain the sinking of the Estonia 1994, which
the SPF has carried out, shall be completed by an
independent investigation and that it shall not
include delegates and experts from Estonia, Finland
and Sweden. Furthermore it is demanded that the
computer animation of the SPF Pre-study shall not
be done before an independent investigation has
been completed and that the Estonia Fact Bank is
continuously up-dated until the truth of the
sinking of the M/S Estonia has dawned. Mats Ekdahl pointed out that the SPF cannot
decide about all these demands. After thorough
discussion it was decided that the question shall
be further handled and be on the agenda at meeting
with the reference group during the autumn. Next meeting Next meeting with the reference group takes
place Wednesday 15 September, 13.00 - abt. 16.00
hrs at the SPF Minnesanteckningar förda vid
sammanträde med Estoniaprojektets
referensgrupp 26 april 2004 Närvarande: Mats Ekdahl, ordförande,
Vendela Dobson Andersson, Göran Lindmark, Disa
Byman, Michael Öun, Allan Sooman, Frank
Rosenius, Brett Hardman, Birger Stensköld,
Magnus Faxén, Anna Carin Wallenstein, Lasse
Johnsen, Odd Lundkvist, Hans Landberg och Daniel
Westman ... Skrivelse från SEA, AgnEf, FAE och
Vilhelminagruppen Rubricerade anhörigföreningar har i
skrivelse till SPF den 30 mars 2004 bland annat
begärt den så kallade
sjunkförloppsstudie som SPF låtit
utföra fullföljs med en oberoende
utredning och att denna inte ska innefatta
ledamöter och specialister från Estland,
Finland eller Sverige. Vidare kräver man att
den föreslagna dataanimationen av studien inte
genomförs innan en oberoende utredning har
slutförts samt att Estoniasamlingen
löpande kompletteras fram till dess sanningen
om M/S Estonias förlisning kommer i dagen. Mats Ekdahl pekade på att SPF inte kan
fatta beslut om samtliga dessa krav. Efter
ingående diskussion beslöts att
frågan ska beredas vidare och tas upp vid
sammanträde med referensgruppen under
hösten. Nästa sammanträde Nästa sammanträde med referensgruppen
äger rum onsdag den 15 september, 13.00 -ca
16.00 på SPF.
This amazing request has not been mentioned in
any Swedish media.
(written 7 May 2004)
|
Sjunkförloppsstudie Ag Sjunkförloppsstudie 2003-03-28 Vam Frank Rosenius Civ.ing. Staffan Sjöling
Styrelsen för Psykologiskt Försvar Estonia. Sjunkförloppsstudie. Rapport förstudie. 15 bilagor
1. Bakgrund Regeringen har gett SPF i uppdrag att i den faktabank som upprättas inom myndigheten, bör det finnas ett material som åskådliggör hur Estonia kan ha vattenfyllts i haveriets slutskede (Regeringsbeslut 2001-04-19, N2001/4125/TP). SPF bereder denna del av regeringsuppdraget genom att till sig knyta ett par experter. Experterna är Vam (pens) Frank Rosenius samt civ.ing. (skeppsbyggnad) Staffan Sjöling. |
The SPF Pre-study explaining the Estonia sinking Re Sinking Pre-Study 2003-03-28 Vice admiral Frank Rosenius Civ.ing. Staffan Sjöling
Styrelsen för Psykologiskt Försvar Estonia. Sequence of Sinking Study. Report Pre-study. 15 attachments
1. Background The government has given the SPF the task, within the MV Estonia Fact Bank being established by the authority, to include an information package that shows how the Estonia could have been flooded with water during the final events of the accident (Government Decision 2001-04-19, N2001/4125/TP). The SPF prepares this part of the government order by attaching to it two experts. The experts are vice admiral (retired) Frank Rosenius and Staffan Sjöling, M.Sc (Naval architecture). |
||
|
SPF har uppdragit åt experterna att genomföra en förstudie. Syftet med förstudien är att med utgångspunkt i haveriutredningens rapport översiktligt analysera möjliga vägar för vatteninströmning i fartyget och konsekvenser av detta för sjunkförloppet. Förstudien skall skapa underlag för den vidare beredningen av regeringens uppdrag. Denna förstudie avrapporteras härmed. |
The SPF has requested the experts to make a pre-study. The objective of the pre-study is, based on the official accident report, to superficially analyse different ways of water inflow into the ship and the resulting consequences of inflow with regard to the sequence of sinking. The pre-study shall create a base for further treatment of the government order. This pre-study is hereby reported. |
||
|
2. Överväganden och inriktning Arbetsgruppen har som allmän utgångspunkt utnyttjat de slutsatser och övriga uppgifter av relevans för sjunkförloppet som finns redovisade i JAIC's slutrapport [1]. Vissa av dessa uppgifter finns sammanställda i bilaga 1. |
2. Considerations and objectives The work group has as a general starting point used the conclusions and other relevant information of the sequence of sinking as reported in the Final JAIC report [1]. Some of the information is collected in attachment 1. |
||
|
Arbetsgruppen har haft begränsade resurser vilket endast medgivit översiktliga beräkningar och att ett begränsat antal exempel kunnat studeras. För att trots detta erhålla så stor bredd som möjligt i redovisade exempel har vi valt att utnyttja de ytterligheter på inströmningsförlopp som slutrapporten ger underlag för. |
The work group has had limited resources, which have only allowed superficial calculations and that a limited number of example could be studied. Regardless, in order to achieve as large width as possible in the shown examples, we have chosen to use the extremes of sequences of inflow as the Final report is supporting. |
||
|
Beträffande den första delen i haverifasen - när bogvisiret bröts loss från fartyget och därmed förorsakad vatteninströmning på bildäck- har vi utnyttjat i haverirapporten redovisade min- respektive maxvärden på vatteninströmning - 300 ton/min resp. 1 800 ton/min. Anmärkning av
Björkman: Det är oklart vad som
menas med 'den första delen i
haverifasen' och
vatteninströmning i
överbyggnaden. Det tar 40
resp. 6 minuter 40 sekunder att fylla
överbyggnaden med 12 000 ton vatten
vid de givna inflödena, men enbart 1
800 ton vatten behövs för att
Estonia kapsejsar och flyter upp och ner -
efter sex resp. en minut. Den
första delen i haverifasen leder till
blixtsnabb kapsejsning. |
Regarding the first phase of the accident - when the visor was ripped away from the ferry and thereby caused the water inflow onto the car deck - we have used the minimum respective maximum values of inflow of the Final report - 300 tons/min respectively 1 800 tons/min. Remark by
Björkman: It is not clear what is
meant with the 'first phase of the
accident' and inflow into the
superstructure at various rates. It
takes 40 minutes resp. 6 minutes 40
seconds to fill 12 000 tons water into the
superstructure at the given rates, but
only 1 800 tons is required to capsize the
Estonia upside down - after six resp. one
minutes. The first phase of the
accident should cause immediate
capsize. |
||
|
För det fortsatta sjunkförloppet finns det två dimensionerande parametrar, nämligen (1) hur snabbt däcken ovanför bildäck vattenfylls i samband med fartygets ökande slagsida samt (2) hur vatten når däcken under bildäck och när så sker, hur fort detta förlopp går. Denna sist nämnda parameter är avgörande för att beräkna fartygets successivt reducerade flytförmåga som leder till att fartyget sjunker. |
For the subsequent sequence of the sinking there are two limiting parameters, thus (1) how fast the decks above the car deck are filled with water due to increasing angle of list, and (2) how water reaches the decks below the car deck and when it happens, how fast this event takes. The latter parameter is decisive to calculate the gradually reduced buoyancy capacity that results in the sinking of the vessel. |
||
|
Beträffande vatteninströmning på däcken ovanför bildäck anger haverirapporten att detta sker genom att bordvarts liggande fönster på SB-sidan slås sönder av vågorna samt genom dörrarna på akterkant av däckshusbyggnaden. Dessa dörrar är klenare till konstruktionen än fönstren. Vi har därför valt att studera två huvudexempel - ett där vatteninströmning endast sker genom dörrarna och ett där det sker genom både dörrar och 10 av de stora fönstren på resp. däck 4 - 6 (d.v.s. 100 % av dessa fönster är helt intryckta av vågorna). För däck 7 och 8 räknas vatteninströmningen endast genom de dörrar som där finns. Inom resp. exempel har tidsförloppet beräknats utifrån två variationer på vatteninströmningen på bildäck - 300 ton/min resp. 1 800 ton/min. Detta leder till att vi redovisar fyra tidsförlopp, två för resp. studerat huvudexempel. |
Regarding water inflow on the decks above the car deck the Final report states that it occurs when the lee side windows on the starboard side are broken by the waves and through the aft side doors of the deckhouse. These doors are of weaker design than the windows. We have therefore chosen to study two principal examples - one where water inflow is only through the doors and one where it takes place through both the doors and 10 of the big windows on respective decks 4 - 6 (i.e. 100% of these windows are totally pushed in by the waves). For decks 7 and 8 the water inflow only through the existing doors is considered. Within respective example has the time sequence been calculated with regard to two different water inflows on the car deck - 300 tons/min respectively 1 800 tons/min. It means that we present four time sequences, two for respective studied main example. |
||
|
Avseende vatteninströmning på däcken under bildäck utgör detta sjunkförloppets "kärnfråga". Genom konstruktionen med en s.k. centercasing mitt i fartyget för all förbindelse - trappor, avgaser, ventilation mm - mellan de övre däcken och däck 1 och 0 så skall inget vatten kunna tränga in i de undre däcken förrän vatten når branddörrarna i centercasingen på bildäck och/eller när vatten når luftintagen i området vid skorstenen på däck 8. Detta sker först vid ca 90 graders slagsida. |
Regarding water inflow on the decks below the car deck, it constitutes the "central question" of the sequence of the sinking. By design with a so called centre casing in the centre line of the vessel for all communications - stairs, exhaust, ventilation, etc., - between the upper decks and decks 1 and 0, no water shall penetrate down to the lower decks until water reaches the fire doors in the centre casing on the car deck and/or when water reaches the air inlets at the funnel on deck 8. The latter only happens at 90 degrees list. |
||
|
Arbetsgruppen har dock funnit i byggnadsvarvets ritningar [4] [5] [6], som beskriver ventilationssystemen ombord, att det bordvarts finns 6 ventilationskanaler på SB- resp. BB-sida vilka leder luft till/från maskinområdet från utsidan av fartyget (underkant däck 4). Vatten kan via dessa kanaler snabbt och i större mängd nå de undre däcken redan vid ca 40 graders slagsida. Dessa ventilationskanaler har endast brandavstängningsventiler som hanteras manuellt från bildäck vilket talar för att de ej stängdes under olycksförloppet. Arbetsgruppen har därför antagit att dessa ventilationskanaler var öppna. |
The work group has however found shipyard drawings [4] [5] [6] of the ventilation system, which describe the existence of 6 ventilation ducts on starboard respective port side, which directs air to/from the engine spaces from the outside of the ship (just below deck 4 level). Water can via these ducts fast and in larger amounts reach the lower decks already at about 40 degrees list. The vent ducts are only fitted with manual fire dampers on the car deck, which suggest that they were not closed during the sequence of the accident. The work group has therefore assumed that these ventilation ducts were open. |
||
|
3. Redovisning av exempel på sjunkförlopp 3.1 Beräkningsmodell För beräkning av fyllnadsförloppet har det skeppsbyggnadstekniska mjukvaruprogrammet NAPA använts. Mjukvarumodellen av Estonia beskriver fartygets skrovform samt indelning i tankar och rum. Modellen är densamma som före olyckan använts vid beräkning av fartygets stabilitet samt samma modell som använts av haverikommissionen. |
3. Description of examples of sinking 3.1 Calculation model To calculate the flooding sequence the naval architecture software program NAPA is used. The software model of the Estonia describes the ship's hull form and partitions into tanks and compartments. The model is the same, which was used before the accident to calculate the ship's stability and the one that was used by the accident investigation commission. |
||
|
Modellen har kompletterats. Den modell SPF erhållit sträckte sig endast upp till däck 4, 13.4 m över baslinjen. Utifrån generalarrangemangsritningar har modellen kompletterats för att inkludera hela fartyget. Detta har gjorts för att på ett så korrekt sätt som möjligt kunna beräkna fyllnadsförloppet. Fartygsmodellens utsträckning återges i bilaga 2. |
The model has been added to. The model SPF was given had an extension only up to deck 4, 13.4 m above base line. Based on general arrangement drawings the model has been enlarged to include the whole ship. It has been done in as correct manner as possible in order to calculate the flooding sequence. The extension of the ship model is shown in attachment 2. |
||
|
Modellen har även kompletterats med de mest väsentliga flödesöppningarna. Flödesöppningarna återges i bilaga 3. |
The model has also been fitted with the essential inflow openings. The inflow openings are shown in attachment 3. |
||
|
I bilaga 2, över beräkningsmodellens utsträckning, kan man se att däcken ovan bildäck är indelade i avdelningar. Denna indelning valdes för att få möjlighet att studera ett successivt inflöde av vatten på varje däck. Beräkningar är genomförda både för däck indelade i flera delar samt för varje däck som en helhet. |
In attachment 2 of the extension of the model you can see that the decks above the car deck are divided into compartments. This interior division was selected in order to study the successive inflow of water on every deck. The calculations are done both for decks divided into several parts and for each deck as a complete unit. |
||
|
3.2 Avgränsningar Att göra en detaljerad studie av fyllnadsförloppet är mycket svårt. Speciellt gäller detta de olika vägar vattnet kan ha trängt in i fartyget. Att säga att ett sätt som fartyget vattenfylldes på är det riktiga är i praktiken omöjligt. Att i detalj rekonstruera vilka vägar vattnet tog, hur mycket vatten som trängde in i de olika tidsskedena och hur detta minut för minut påverkade sjunkförloppet har arbetsgruppen ej kunnat göra utan vi redovisar exemplen översiktligt. |
3.2 Limitations To make a detailed study of the flooding sequence is very difficult. This concerns in particular the various ways water can have penetrated into the vessel. To say that one way the ship was flooded is the correct one is in practice impossible. To simulate in detail what ways the water took, how much water that entered at different times and how this, minute by minute, affected the sequence of sinking has not been possible for the work group. Instead we show the examples superficially. |
||
|
Tidsförloppen för vatteninströmningen i olika delar av fartyget är, som angivits ovan, svåra att exakt beräkna med det underlag och de verktyg som arbetsgruppen haft tillgång till. Angivna tider är därför approximativa. JAIC´s slutsatser angående att vattentäta avdelningar samt att branddörrar till bildäck stängdes tidigt har legat till grund för beräkningsexemplen utom avseende det som berör de bordvarts placerade ventilationstrummorna till maskinområdet. |
The time sequences of water inflow in different parts of the ship are, as stated above, difficult to calculate exactly with the input and tools available to the work group. Given times are therefore approximate. The conclusions of the JAIC regarding the early closing of the watertight compartments and the fire doors on the car deck are the base of the calculated examples except what concerns the side vent ducts to the engine spaces. |
||
|
Studien har genomförts med ett antal övriga begränsningar enligt nedan: · Studien är genomförd helt statisk. Ingen hänsyn har tagits till inverkan av fartygets rörelser. · Flödesöppningarna har inte kunnat modelleras fullständigt. I ett fartyg finns ett stort antal öppningar genom vilka vatten kan ta sig in i fartyget samt genom vilka vatten kan ta sig från ett utrymme till ett annat. Att fullständigt beskriva dessa samt att ta dem i beaktande är nästan ogörligt. · Beräkningarna för inflöde av vatten in i fartygets olika utrymmen är av enkel karaktär. Inga dynamiska effekter eller strömningsförluster har beaktats. · Beräkningarna har genomförts för stora krängningsvinklar och med stora mängder vatten ombord. Liknande beräkningar förekommer inte särskilt ofta i daglig skeppsbyggnadsteknik. I en del fall har datorprogrammet varnat för att beräkningsnoggrannheten närmat sig gränserna för det tillåtna. Det är ett fenomen som uppträder just vid stora trim och stora krängningsvinklar även vid vanlig läckstabilitetsberäkning. · Ingen effekt av en eventuell lastförskjutning har beaktats. · Vid stabilitesberäkningarna med vatten på bildäck har beräkningsmodellen tvingats till att kränga åt SB. Detta eftersom datorprogrammet känner av att bildäcket är asymmetriskt. Då centercasingen på bildäck ligger om SB väljer programmet automatiskt att kränga fartyget åt BB. Detta kan förhindras genom att välja beräkning för SB krängningsvinklar. · I och med att datorprogrammet räknar med lost bouyancy-method blir beräkningarna i en del fall missvisande. Ett exempel på detta kan iakttagas vid vattenfyllnaden av bogtrusterrummet, T210. När rummet ligger under lugnvattenytan fylls det med vatten. När fartyget får ett stort akterligt trim och rummet lyfts över vattenytan försvinner den mängd vatten som fyllt rummet i ett tidigare skede. Så var med säkerhet inte fallet i verkligheten. |
The study has been done with a number of additional limitations as follows: · The study is made fully static. No consideration is given to vessel movements. · The inflow openings have not could be modelled correctly. In a vessel there are a large number of openings through which water can enter into the ship and through which water can move from one compartment to another. To describe all these and to consider them is almost impossible. · The inflow calculations into the different compartments of the ship are of simple character. No dynamic effects or flow losses are considered. · The calculations have been done for large angles of heel and with large amounts of water onboard. Similar calculations are rarely done in daily naval architecture work. In some cases the computer soft ware has warned that the calculation accuracy is close to allowable limits. It is a phenomenon that appears at large trim and large angle of heel also at usual damage (leak) stability calculations. · No effects of shifting cargo have been considered. · At the stability calculations with water on the car deck the model has been forced to list to starboard. This is due to the program feeling that that the car deck is asymmetric. As the centre casing is located to starboard, the program chooses automatically to list the vessel to port. Choosing calculation of starboard angles of list can prevent it. · As the computer programme calculates with 'lost buoyancy method', the calculations become in some cases misleading. One example of this can be seen when the bow thruster compartment T210 is flooded. When the compartment is below the still water line it fills with water. When the ship trims a lot on the stern and the compartment is lifted above the water surface, a large amount of water disappears, which was previously inside the compartment. In reality the case was certainly different. |
||
|
3.3 Lastkondition Den lastkondition som använts i dessa beräkningar är hämtad från [2], Loading Condition K.0, Departure from Tallinn. Lastkonditionen är korrigerad för visirets vikt om -59 ton x=138.3 z=10.62. Uppgifter för visirets vikt och tyngdpunkt är hämtade från [3]. Lastkonditionen, kallad L2, finns presenterad mer i detalj i bilaga 4. |
3.3 The Loading Condition The loading condition used in these calculations is taken from [2], Loading Condition K.0, Departure from Tallinn. The loading condition is corrected for the weight of the visor of -59 ton x=138.3 z=10.62. The info of the visor weight and location is taken from [3]. The loading condition, called L2, is described in more detail in attachment 4. |
||
|
3.4 Vatten på bildäck Utifrån lastkondition L2 har fartygets stabilitet beräknats för en ökande mängd vatten på bildäck. Lastfall L2 har beräknats med en vattenmängd från 0 till 12 000 ton på bildäck. Dessa lastfall kallas C0-C31 och finns presenterade i bilaga 5.
|
3.4 Water on the car deck In load condition L2 the vessel stability has
been calculated with increasing amounts of water on
the car deck. Load condition L2 has been calculated
with a water amount from 0 to 12 000 tons. These
load conditions are called C0-C31 and shown in
|
||
|
3.5 Beräkningsmetodik I den här studien har två alternativa beräkningsmetoder använts. Dels har de olika utrymmena i fartyget steg för steg fyllts med vatten för att försöka efterlikna ett troligt fyllnadsförlopp så bra som möjligt. Dels har fartyget utifrån ett initialt lastfall med vatten på bildäck beräknats med successivt minskande deplacerande volym. |
3.5 Methods of calculation In this study two alternative methods of calculation have been used. On the one hand the various compartments are filled step by step with water in order to simulate a probable sinking sequence as well as possible. On the other hand an initial loading case with water on the car deck is used and the condition is calculated for step-by-step reduced displacing volume (buoyancy) of the ship. |
||
|
Den beräkningsmetod som visade sig fungera bäst och som gav bäst överblick över händelseförloppet var den senare. Beräkningarna kunde inte genomföras på ett traditionellt sätt. Normalt utgår man från ett lastfall utan inträngt vatten och beräknar steg för steg vad som händer när fartyget successivt fylls med vatten. I dessa beräkningar var man dock tvungen att utgå från lastfall med vatten på bildäck. |
The best method of calculation was the latter and it gave also a clear view of what happened. The calculations could not be done in a traditional manner. Normally you start from a loading condition without inflow of water and calculate step by step what happens when the ship is gradually filled with water. In these calculations we were however forced to start with loading condition with water on the car deck. |
||
|
Mängden vatten på bildäck har i beräkningarna ökats. När vattenmängden ökat har fartygets slagsida ökat. Med ökande slagsida har fartygets flödesöppningar successivt kommit under vatten. När flödesöppningarna kommit under vatten har de utrymmen öppningarna leder till flödats med vatten. Fyllnadsförloppet är beräknat stegvis. De olika utrymmena i fartyget har ansatts fyllas i diskreta steg. I verkligheten var nog förloppet mer regelbundet. |
The amount of water on the car deck has in the calculations been increased (stepwise). When the amount of water has increased, then the ship's angle of list has increased. With increasing angle of list the inflow openings of the ship comes below water one after the other. When the inflow openings are submerged, the associated/connected compartments are flooded with water. The sequence of flooding is computed stepwise. The various compartments are assumed to be flooded in discrete steps. In reality the sequence was probably more continuous. |
||
|
I den här studien har inte eventuell vattenfyllnad av fartygets tankar beaktats. Det är möjligt att vatten trängt in även i dessa. Men omfattningen av en sådan vatteninträngning är svår att efterlikna. Många tankar var förmodligen ventilerade med svanhalsar vilka oftast har ett fyllnadsskydd. Det enda undantaget från detta är den aktra ballasttanken T58. Den aktra ballasttanken förväxlades tyvärr med styrmaskinrummet, T1500. Detta upptäckte vi i ett allt för sent skede. Styrmaskinrummet har en något större volym än tank T58 men är placerad längre föröver. |
In this study final water filling of the ship's tanks is not considered. It is possible that water has also flooded the tanks. But the extent of such inflow is difficult to simulate. Many tanks were probably ventilated with swan necks, which are fitted with non-return closing appliances. The only exception is the aft ballast tank T58. The aft ballast tank was mixed up with the steering gear room, T1500. We discovered this to late in the study. The steering gear room has a slightly larger volume than tank T58 but is located further forward. |
||
|
För att på ett så noggrant sätt som möjligt försöka beskriva sjunkförloppet har beräkningarna genomförts för fartygets hela volym. Den enda del av fartyget som inte tagits med som bidragande till flytbarheten är fartygets skorsten. |
In order to try, as carefully as possible, describing the sequence of sinking, the calculations have been carried out for the complete volume of the vessel. The only part that has not been considered contributing to the buoyancy is the ship's funnel. |
||
|
3.6 Fyllnadsförlopp Utifrån haverikommissionens beskrivning och vittnesmålens uppgifter har två tänkbara exempel på fyllnadsförlopp studerats närmare. I deras beskrivning av fyllnadsförloppet har fartygets slagsida och dess akterliga trim tilltagit. I ett slutskede, strax innan fartyget försvann från ytan, har det från att ha haft en kraftig SB slagsida roterat runt helt och slutligen sjunkit. |
3.6 Sequences of water filling Based on the description of the accident commission and the observations of the testimonies two possible examples of sequences of water filling have been studied closer. In their descriptions of sequence of water filling the ship lists and the stern trim increases. In one final stage, just before the ship disappeared from the surface, it has from having a severe starboard list rotated completely and finally sunk. |
||
|
I det först studerade fyllnadsförloppet, Exempel 1, har vattnets inträngning i fartyget enbart antagits kunna ske genom fartygets rampöppning, dörrar och ventilationskanaler. |
In the first studied sequence of water filling, Example 1, water inflow into the vessel is assumed only through the ship's ramp opening, doors and ventilation ducts. |
||
|
I det andra studerade fyllnadsförloppet, Exempel 2, har vattnets väg in i fartyget antagits kunnat ske genom att fönsterrutor på däck 4-6 krossats av vattnets tryck och vågornas kraft samt genom fartygets rampöppning, dörrar och ventilationskanaler. |
In the other studied sequence of water filling, Example 2, it is assumed that water inflow through the broken windows on deck 4-6 is possible and that water flows in through ramp opening, doors and ventilation ducts. |
||
|
3.6.1 Exempel 1 Utifrån lastfall L2 har försök gjorts för att rekonstruera fyllnadsförloppet. Lastfall L2 har beräknats med olika mängd vatten på bildäck, lastfall C0-C31. Utgående från dessa lastfall har fartyget beräknats för successiv vattenfyllnad i hela fartygets struktur. Fyllnadsförloppet finns beskrivet i bilaga 6 och flytläge i de olika skedena finns beskrivet i bilaga 7. GZ-kurvor för fyllnadsförloppet i Exempel 1 återfinns i bilaga 8. |
3.6.1 Example 1 In load condition L2 attempts have been made to simulate the sequence of water filling. Load condition 2 has been computed with various amounts of water on the car deck, load cases C0-C31. Starting from these load cases, the complete water filling of all ship structure has been computed. The sequence of water filling is described in attachment 6 and the floating positions at the various stages are described in attachment 7. GZ curves for the sequence of water filling in Example 1 are shown in attachment 8. |
||
|
När fartyget förlorade sitt visir tränger stora mängder vatten in på bildäck. Med 600 ton inträngt vatten på bildäck har fartyget en slagsida på ca 16 grader, C3. Då mer vatten tränger in i fartyget ökar slagsidan samtidigt som det akterliga trimmet minskar något. Med 1 300 ton vatten på bildäck är slagsidan ca 28 grader. |
When the vessel lost its visor large amounts of water flows onto the car deck. With 600 tons water inflow the ship has an angle of list of about 16 degrees, C3. When more water flow into the ship, the angle of list increases while at the same time the stern trim is slightly reduced. With 1 300 tons on the car deck the angle of list is about 28 degrees. |
||
|
Då 1 900 ton vatten trängt in på fartygets bildäck kommer de första flödesöppningarna under vatten. Det är ventilationsöppningarna för tilluft till huvudmaskinrum, separatorrum, KaMeWa-rum och maskinverkstad (T1010, T1110, T1210, T1310). Dessa börjar vattenfyllas. Slagsidan är nu ca 38 grader. (C8/DX7F 2 EQ) På ritning [4] [5] och [6] kan man se var dessa ventilationskanaler är placerade. Under resten av fyllnadsförloppet ökar fartygets trim på aktern.
|
When 1 900 tons of water has flowed onto the car deck, the first inflow openings come below water. They are the vent duct openings for supply air to the main engine room, the separator room, the KaMeWa-room and the engine workshop (T1010, T1110, T1210, T1310). These start to fill. The angle of list is now about 38 degrees. (C8/DX7F 2 EQ) On drawings [4] [5] and [6] you can see where these ventilation ducts are located. During the remaining sequence of water filling the stern trim increases.
|
||
|
Därefter kommer de stora SB-ventilationsöppningarna till bildäck under vatten. Detta sker vid ca 40 grader slagsida. 4 cirkulära ventilationsschakt i fören och 4 i aktern, med ca 1m diameter, leder ner till bildäck. När dessa ventilationsschakt når vattenytan ökar vatteninträngningen till bildäck ytterligare utöver inträngningen genom bogrampsöppningen. Bogrampens nedre hörn ligger fortfarande över vattenytan. |
Thereafter the big starboard vent openings to car deck come under water. It happens at about 40 degrees list. 4 circular vent shafts at the bow and 4 at the stern, with about 1 m diameter, lead down to the car deck. When these vent shafts reach the water surface, the water inflow onto the car deck increases in addition to the flow through the bow ramp opening. The lower corner of the bow ramp lies still above the water surface. |
||
|
När vattenmängden på bildäck är ca 3 900 ton och slagsidan är ca 51 grader når vattenytan den akterliga dörren på SB sida till däck 5. Denna dörr nås tidigare av den omgivande vattennivån än den akterliga dörren på däck 4 som är placerad mer in mot fartygets centerlinje. Ungefär samtidigt som däck 5 börjar vattenfyllas akterifrån kommer ventilationen till styrmaskinrummet(T58) under vatten. Ventilationen av styrmaskinrummet framgår av ritning [5]. (C15 DX7F 3 EQ) |
When the water on the car deck amounts to about 3.900 tons and the list is about 51 degrees the water surface reaches the aft door on starboard side deck 5. This door is reached by outside water level before the aft door on deck 4, which is located more to the ship's centreline. About the same time as deck 5 starts filling from aft, the vent openings to the steering gear room (T58) comes below water. The steering gear vent system is seen on drawing [5]. (C15 DX7F 3 EQ) |
||
|
När hela däck 5 och hela maskinrum T1010-T1310 vattenfyllts samt med en vattenmängd om ca 5 500 ton på bildäck och en slagsida på ca 56 grader återstår ca 0.5 m till den aktre SB dörren på däck 4. I beräkningarna har inte slagsidan och fartygets sättning blivit så stor att denna dörr kommit under vattenytan i detta skede. Men eftersom fartyget rullade och hävde är det inte osannolikt att vatten kunde ta sig in på däck 4 genom denna dörr. (C21/DX7F 6 EQ) När bildäck fyllts med ca 5 500 ton vatten är vattennivån så hög inne på bildäck att den når dörrarna från centercasingen till bildäck. Vatteninträngning genom dessa är dock inte beräknad i det här skedet, utan antas inträffa senare. |
When the whole deck 5 and all the engine rooms T1010-T1310 are water filled and with about 5 500 tons of water on the car deck and at an angle of list of 56 degrees, 0.5 m remains to the aft starboard door on deck 4. In the calculations the angle of list and the trim of the ship have not become large enough to submerge this door. But as the ship was rolling and heaving, it is not unlikely that water could enter onto deck 4 through this door. (C21/DX7F 6 EQ) When the car deck is flooded with about 5 500 ton water, the level of water is so high on the car deck that it reaches the doors of the centre casing to the car deck. Water inflow through these are not calculated at this stage but is assumed to occur later. |
||
|
Med vattenfyllning akterifrån på
däck 4 och med en vattenmängd om ca 7 000
ton på bildäck är slagsidan ca 65
grader. I det skedet kommer den aktra SB
dörren på däck 6, dörren vid
spant #49 på däck 7 samt SB bryggvinge
under vatten. Rummen på däck 6 och 7
börjar fyllas med vatten. ( Strax därefter når vattenytan de aktra SB dörrarna på däck 8 och däck 7. Slagsidan är då ca 75 grader. I dessa beräkningar har det antagits att förrådsutrymmen, T1120-T1420 kan ha börjat vattenfyllas i detta skede. (C21/DX7F 13 EQ) När slagsidan är ca 83 grader och vattennivån är i höjd med ventilationsutrymmena på däck 8 ökar förmodligen vatteninträngningen i fartygets olika delar genom det komplexa ventilationssystemet. |
With water flooding in aft on deck 4 and with
about 7.000 tons of water on the car deck the angle
of list is about 65 degrees. At that stage the aft
starboard door on deck 6, the door at frame #49 on
deck 7 and the starboard bridge wing are submerged.
The rooms on deck 6 and 7 start to fill with water.
( Soon after the water level reaches the aft starboard doors on deck 8 and deck 7. The angle of list is then about 75 degrees. It is assumed in these calculations that the storeroom, T1120-T1420 may have started to be water filled at this stage. (C21/DX7F 13 EQ) When the angle of list is about 83 degrees and the water level is at the height of the ventilation spaces on deck 8, the water inflow probably increases into the ships different parts through the complex ventilation system. |
||
|
Fartygets slagsida, trim och sättning
ökar varefter de olika utrymmena vattenfylls.
Med 9 000 ton vatten på bildäck är
slagsidan ca 83 grader och fartygets skorsten
når vattenytan. Under förloppet har
även de olika däckens akterliga BB
dörrar kommit under vatten. Med en vattenmängd om ca 10 000 ton
på bildäck och när slagsidan
är ca 88 grader har i denna beräkning
även hjälpmaskinrummet och
maskincentralen vattenfyllts, T910 och T920.
Hjälpmaskinrummet saknade ventilationstillopp
som mynnade i fartygssidan och har troligtvis
vattenfyllts via ventilationsaggregaten på
däck 8. I det här skedet ligger
nästan hela aktern under vatten och slagsidan
är ca 90 grader. (C27/DX7F 21 EQ) Med 12 000 ton vatten på bildäck och när de sista utrymmena på däcksnivå 8 och 9 vattenfyllts slår fartyget runt med botten upp samt med ett stort trim. I denna studie har de förliga förläggningarna för om maskinrummen inte antagits börja fyllas förrän i detta skede. Det är dock troligt att detta inträffat i ett tidigare skede, baserat på vittnesuppgifter samt att vattennivån når dörrar och hissar i centercasingen redan med ca 5.500 ton vatten på bildäck. |
The list, the trim and the draft increase when the various compartments are water filled. With 9 000 tons of water on the car deck the angle of list is about 83 degrees and the ship's funnel reaches the water surface. At this stage the aft port doors on the various decks have come below water. With about 10 000 tons of water on the car deck and when the angle of list is about 88 degrees in this calculation the auxiliary engine room and the engine control room are flooded, T910 and T920. The auxiliary engine room lacked ventilation entries that ended at the ship's side and has probably been water filled via the ventilation unit on deck 8. At this stage the whole aft part is below water and the angle of list is about 90 degrees. (C27/DX7F 21 EQ) With 12 000 tons water on the car deck and when the last compartments on deck levels 8 and 9 are flooded, the ferry turns upside down with the bottom up and a large trim. In this study the passenger rooms forward of the engine room are not assumed to be flooded until this stage is reached. It is however probable that it has happened earlier based on testimonies and the fact that the water level reaches doors and elevators in the centre casing already with about 5 500 tons of water on the car deck. |
||
|
I dessa beräkningar sjunker inte fartyget helt och hållet. Det beror bland annat på att inga beräkningar kunde genomföras med större mängd vatten på bildäck än 12.000 ton. 12 000 ton är ungefär 2/3 av hela bildäckets volym. Vid försök med större mängd vatten på bildäck har datorprogrammet låst sig. Eftersom beräkningar med mer än 12 000 ton vatten på bildäck inte kan genomföras innebär det, både för Exempel 1 och Exempel 2, att slutfasen av sjunkförloppet inte kan beskrivas i datormodellen. Efter steg C10/DX7F 2 EQ låg dock de stora ventilationskanalerna från akterkant av däck 4 till bildäck under vatten hela tiden. Genom dessa fylldes bildäck på kontinuerligt och fartyget sjönk. Just slutfasen i sjunkförloppet är svår att försöka efterlikna. När bildäck slutligen fyllts helt med vatten gick nog slutfasen i sjunkförloppet väldigt snabbt. Detta kan ha skett tidigare än beskrivet i denna beräkning. Bogrampens öppning ligger dock över lugnvattenytan under hela förloppet. Fram till steg C18/DX7F 7 EQ kommer den allt närmare vattenytan för att efter detta steg åter höja sig över lugnvattenytan. I sidovyn av fartyget kan man se att fartyget i steg 23 flyter upp och ned med skorstenen i riktning föröver. I det efterföljande steget, steg 24, flyter fartyget i det närmaste vertikalt och med skorstenen pekande akteröver. Detta beror på beräkningsprogrammets svårighet att tolka och presentera beräkningsresultatet vid ett sådant extremt flytläge. |
In these calculations the vessel does not sink completely. It is among other reasons due to no calculations being done with more than 12 000 tons on the car deck. 12 000 tons is about 2/3 of the total car deck volume. At attempts with larger amounts of water on the car deck the computer programme locks itself. As calculations with more than 12 000 tons water on the car deck cannot be done, this means that the computer model cannot describe the final phases of the sequences of sinking for both Example 1 and Example 2. After step C10/DX7F 2 EQ the big ventilation ducts from aft edge of deck 4 to the car deck were submerged all the time. Through these the car deck was continuously filled and the ship sank. Particularly the final phase of the sequence of sinking is difficult to simulate. When the car deck was finally wholly filled with water, the final phase of the sequence of sinking went very fast. It may have occurred earlier than described in this calculation. The opening of the bow ramp is however above the still waterline during the whole sequence. Up until step C18/DX7F 7 EQ it comes closer to the water but after this step it rises again above the still water surface. In the side view of the vessel you can see that the vessel in step 23 floats upside down with the funnel in the forward direction. In the following step, step 24, the ship floats almost vertically and with the funnel pointing aft. It is due to difficulty of the computer programme to interpret and describe the computation results of such an extreme floating position. |
||
|
3.6.2 Exempel 2 I detta exempel har det antagits att vattnets tryck och vågornas kraft krossat de stora fönsterrutorna i fartygets sida. Fyllnadsförloppet finns beskrivet i bilaga 9 och flytläge i de olika skedena finns beskrivet i bilaga 10. GZ-kurvor för fyllnadsförloppet i Exempel 2 återfinns i bilaga 11. Som i det tidigare exemplet når flödesöppningarna till de aktra maskinrummen (T1010, T1110, T1210, T1310) vattenytan då 1 900 ton vatten strömmat in på bildäck och slagsidan är ca 37 grader. I detta exempel kommer vatten att kunna tränga in på däck 4 i ett tidigare skede än i det tidigare exemplet. Med 2 400 ton vatten på bildäck och 45 graders slagsida antas vatten ha strömmat in på däck 4. Vatteninströmningen på däck 4-6 antas ha skett akterifrån och stegvis föröver. Med 3 900 ton vatten på bildäck har slagsidan ökat till ca 56 grader och däck 5 börjar vattenfyllas akterifrån. Samtidigt fylls däck 4 förut, styrmaskinrummet (T58) och bogpropellerrummet. (C15/DX7W 4 EQ) |
3.6.2 Example 2 It is assumed in this example that the pressure of the water and the forces of the waves have destroyed the large windowpanes in the ship's side. The sequence of water filling is described in attachment 9 and the floating positions of the various stages are described in attachment 10. GZ-curves of the sequence of water filling of Example 2 are shown in attachment 11. Exactly as in the earlier example the inflow openings to the aft engine rooms (T1010, T1110, T1210, T1310) are submerged when 1 900 tons of water has flooded the car deck and the angle of list is about 37 degrees. In this example water will enter deck 4 at an earlier stage than in the previous example. With 2 400 tons of water on the car deck and 45 degrees list it is assumed that water has flooded deck 4. The water inflow on decks 4-6 is assumed to have taken place aft and stepwise forward. With 3 900 tons of water on the car deck the angle of list has increased to about 56 degrees and deck 5 starts to be water filled from aft. At the same time deck 4 forward, the steering gear room (T58) and the bow thrusters room. (C15/DX7W 4 EQ) |
||
|
Med 3 900 ton vatten på bildäck har slagsidan ökat till ca 56 grader och däck 5 börjar vattenfyllas akterifrån. Samtidigt fylls däck 4 förut, styrmaskinrummet (T58) och bogpropellerrummet. (C15/DX7W 4 EQ) När 5 500 ton vatten strömmat in på bildäck och slagsidan är ca 62 grader antas däck 6 ha flödats med vatten samtidigt som vatteninträngningen fortsätter föröver på däck 4 och 5. (C18/DX7W 6 EQ) Då vattenmängden på bildäck är 7 000 ton och slagsidan 76 grader börjar däck 7 vattenfyllas. (C21/DX7W 7 EQ) Efter det antas maskinrummen T1010-T1310 ha fyllts helt. SB bryggvinge når vattenytan och börjar vattenfyllas. Vid ca 85 graders krängning når vattenytan däck 8, (C21/DX7W 9 EQ) |
With 3 900 tons of water on the car deck the angle of list has increased to about 56 degrees and deck 5 starts to be water filled from aft. At the same time deck 4 forward, the steering gear room (T58) and the bow thrusters room. (C15/DX7W 4 EQ) When 5 500 tons water has flooded the car deck and the list is about 62 degrees, deck 6 is assumed to be flooded with water, while simultaneously water inflow forward on decks 4 and 5 continues. (C18/DX7W 6 EQ) With 7 000 tons of water on the car deck and angle of list about 76 degrees, deck 7 aft starts to fill with water. (C21/DX7W 7 EQ) After that it is assumed that engine rooms T1010-T1310 have been totally filled. Starboard bridge wing reaches the water surface and starts to be flooded. At about 85 degrees list the water level reaches deck 8, (C21/DX7W 9 EQ) |
||
|
I det här läget har de övre förrådsrummen (T1120-T1420) antagits vattenfyllas på liknande sätt som i Exempel 1. (C21/DX7W 12 EQ) När 10 000 ton vatten trängt in på bildäck ändrar fartyget flytläge från att ligga med 85 graders slagsida till 117 grader i samband med att utrymmen på däck 9, däck 8 samt hjälpmaskinrum och kontrollrum vattenfylls. (C27/DX7W 13 EQ) Med 11 000 ton vatten på bildäck samtidigt som då de sista rummen på däck 8 och 9 vattenfylls roterar fartyget runt med kölen uppåt och ett stort akterligt trim. (C29/DX7W 13 EQ) Precis som i Exempel 1 är inte vattenfyllnad av de förliga förläggningsutrymmena beaktad förrän i detta sena skede. När dessa utrymmen vattenfylls intar fartyget ungefär samma flytläge som i Exempel 1, ett i det närmaste vertikalt stående flytläge. Fartyget kan inte heller i detta exempel beräknas med mer än 12 000 ton vatten på bildäck. |
In this position the upper storerooms (T1120-T1420) are assumed to fill with water similar to Example 1. (C21/DX7W 12 EQ) When 10 000 tons of water has forced itself into the car deck, the vessel changes floating position from 85 degrees to 117 degrees list in connection with the flooding of compartments on deck 9, deck 8 and the auxiliary engine room and the control room. (C27/DX7W 13 EQ) With 11 000 tons of water on the car deck and when simultaneously the last compartments on deck 8 and 9 are water filled, the ship rotates with the keel upwards and with a big stern trim. (C29/DX7W 13 EQ) Exactly as in Example 1 the water filling of the forward passenger compartments are not considered until this late stage. When these compartments are flooded, the ship reaches about the same floating position as in Example 1, an almost vertical floating position. Also in this example the ship's position cannot be calculated when there is more than 12 000 tons of water on the car deck. |
||
|
I Exempel 1 erhåller inte fartyget en slagsida över 90. I Exempel 2 C27/DX7W 13 EQ kan dock en sådan slagsida iakttagas. Detta beror på att de förliga rummen på däck 8 och 9 inte flödats med vatten i det skedet. Vittnesuppgifter talar om att fartyget under en tid hade just en slagsida överstigande 90 grader innan det vände och sjönk. En sådan slagsida kan alltså ha varit resultatet av att förliga rum i de övre däcksregionerna inte vattenfylldes förrän i ett sent skede. I flytlägestabellerna över fyllnadsförloppen, bilaga 7 och bilaga 10 kan man se att slagsidan inte ökar kontinuerligt. Både de aktra maskinrummen T1010-T1310 och förrådsutrymmena T1120-T1420, fylls på successivt i steg. Vatteninträngning i dessa rum motverkar ökningen av slagsida. I dessa beräkningar antas de ha fyllts med vatten i diskreta steg. I verkligheten måste de dock ha fyllts kontinuerligt och samtidigt som övriga delar av fartyget. |
In Example 1 the ship never reaches an angle of list exceeding 90. In Example 2 C27/DX7W 13 EQ can however such list be observed. It is due to the forward compartments on deck 8 and 9 not being flooded with water at this stage. Testimonials report that the ship for a while had a list exceeding 90 degrees before it turned and sank. Such listing can therefore have been the result of forward rooms in the upper deck regions not being flooded until a very late stage. In the tables of floating positions of the sequences of water filling, attachment 7 and attachment10, you can see that the list does not increase continuously. Both the aft engine rooms T1010-T1310 and storerooms T1120-T1420 are filled in steps. The water inflow into these compartments counteracts the increase in list. In these calculations they are assumed to have been filled with water in discrete steps. In reality they must have been flooded continuously at the same time as other parts of the ship. |
||
|
3.6.3 Enbart vatten på däck på och över bildäck En enklare studie har även genomförts där utrymmen under bildäck inte fyllts med vatten. I ett fall där däck 4 till däck 9 successivt fylls med vatten ökar fartygets sättning och slagsida tills dess att det kapsejsar och finner ett stabilt jämviktsläge med botten uppåt. Fartyget sjunker dock aldrig.
3.7 Tidsstudie För de två beräknade fyllnadsförloppen har enkla tidsuppskattningar genomförts. Dessa har genomförts för två fyllnadshastigheter av vattnets inträngning på bildäck. I haverikommissionens rapport anges att vatteninträngningen på bildäck då rampen slets upp var 300-600 ton per minut samt att vatteninträngningen var 2-3 gånger större då slagsidan var 35 grader. Vatteninträngning om 300 ton per minut och 1 800 ton per minut har använts i denna studie. Inga mer detaljerade uppgifter om vatteninträngning på bildäck beroende av fart, kurs, slagsida och rörelser som de som finns presenterade i [7] och [8] har använts.
En enkel uppskattning av hur mycket vatten som kan tränga in i de olika flödesöppningarna baserad på Bernoullis ekvation är genomförd. Denna uppskattning är baserad på flödesöppningarna 1 m under vattenytan, helt öppna, utan strömningsförluster. I varje steg av fyllnadsförloppet har inströmmad mängd vatten i de olika utrymmena beräknats. Den tid det tagit för vattnet att fylla utrymmena har sedan uppskattats. Tiden för fyllnadsförloppet gäller från det att vatten börjar tränga in i fartyget till det att fartyget slår runt. Efter det kan inte volymen av inträngt vatten beräknas. För Exempel 1 har inträngd vattenmängd enbart beaktats för de flödesöppningar som ligger under vattenytan. När fler flödesöppningar till samma utrymme kommit under vatten har vatteninflödet ökat. För däck 4-6 har bara de aktra dörrarna vid spant #4 beaktats. På däck 7 har även de förligare dörrarna beaktats. I Exempel 1 slår fartyget runt efter steg C31/DX7F 21 EQ. Vattenmängden på bildäck är då 12 000 ton. |
3.6.3 Water only on the car deck and decks above the car deck A simpler study has also been carried out where the compartments below the car deck are not filled with water. In one case where decks 4 to 9 are successively filled with water, the draft/trim and heel increases until the ship capsizes and finds a stable equilibrium with the bottom up. The ship however never sinks. 3.7 Time study For the two computed sequences of water filling simple time estimates have been carried out. These have been done for two filling velocities of water inflow on the car deck. In the Final report of the accident commission is stated that the water inflow on the car deck when the ramp was ripped open was 300-600 tons per minute and that the water inflow was 2-3 times bigger when the angle of list was 35 degrees. Water inflow rates of 300 tons per minute and 1 800 tons per minute have been used in this study. No more detailed information of water inflow rates on the car deck due to speed, heading, list and movements than the one shown in [7] and [8] have been used. A simple estimate is done how much water that can flow into the various openings based on the Bernoulli's equation. This estimate is based on inflow openings 1 m below surface, wholly open without flow losses. In every step of the sequence of filling the amount of water inflow of the various compartments have been calculated. The time taken for filling the compartment has then been estimated. The time for the sequence of filling is valid from when water starts to enter the ship until the ship turns turtle. After that the volume of inflow water cannot be calculated. In Example 1 the amount of inflow water has only been considered for inflow openings below waterline. When several inflow openings to the same compartment come below water, the water inflow rate has increased. For decks 4-6 only the aft doors at #4 are considered. On deck 7 also the forward doors are considered. In Example 1 the ship turns turtle after step C31/DX7F 21 EQ. The amount of water on the car deck is then 12.000 tons. |
||
|
För Exempel 2 antas vatteninströmningen ha skett via fartygets fönsterrutor. 10 av de större fönsterrutorna per däck på däck 4-6 antas ha gått sönder då lugnvattenytan nått dem. För däck 7 och 8 som saknar stora rutor antas vatteninströmningen ha skett via flödesöppningarna på samma sätt som i exemplet vatten genom flödesöppningar. I Exempel 2 slår fartyget runt efter steg C27/DX7W 13 EQ. Vattenmängden på bildäck är då 10 000 ton. Följande tider är uppskattade för de två exemplen: Exempel 1, DX7F: 300 T/min 54 min (17 min**) 1 800 T/min 21 min (17 min**) Exempel 2, DX7W: 300 T/min 37 min* (11 min**) 1 800 T/min 14 min (11 min**) Beräkningar av dessa tidsuppskattningar återfinns i bilaga 12, bilaga 13, bilaga 14 och bilaga 15. *I Exempel 2-300 T/min är tiden för vatteninträngning på bildäck mycket dominerande. Att enbart fylla bildäcket med 10 000 ton med en vatteninträngningshastighet om 300 T/min tar 33 min. **Tid för att fylla utrymmen utöver bildäck presenteras inom parentes |
In Example 2 it is assumed that water inflow also takes place via the windows. 10 of the larger windows on each deck of deck 4-6 are assumed to be broken when they are reached by the still waterline. On decks 7 and 8, which lack large windows, water inflow is assumed to be via inflow openings exactly as in the example water through inflow openings. In example 2 the ship turns turtle after step C27/DX7W 13 EQ. The amount of water on the car deck is then 10 000 tons. The following times are estimated for the two examples: Example 1, DX7F: 300 T/min 54 min (17 min**) 1 800 T/min 21 min (17 min**) Example 2, DX7W: 300 T/min 37 min* (11 min**) 1 800 T/min 14 min (11 min**) The calculations of these time estimates are shown in attachments 12, attachment 13, attachment 14 and attachment 15. *In Example 2-300 T/min is the time for water inflow on the car deck very dominating. To only fill the car deck with 10 000 tons with an inflow rate of 300 T/min takes 33 min. **Time to fill the compartments apart from the car deck are shown in brackets |
||
|
Dessa enkla uppskattningar av tiden för vattenfyllning kan enbart användas för att ungefärligen uppskatta om det är möjligt att fartyget kan ha fyllts med vatten på den tid som haverikommissionens slutrapport anger. Troligt är också att vatten tagit sig in på fler ställen än vad som kunnat kartläggas i den här studien. Fartyg har ofta fler möjliga flödesöppningar än vad som framgår av ritningar. Särskilt gäller detta ventilationsanläggningar, som det delvis finns ritningsunderlag på, men som det är mycket svårt att beräkna vatteninflöde för. |
These simple estimates of times of water filling cannot only be used to approximately estimate if it is possible that the ship was filled with water with the time given by the Final report of the accident commission. Probably water has also entered at more locations than pinpointed in this study. Ships often have more possible inflow openings than shown on drawings. Particularly this is valid for the ventilation systems where drawings partly exist but for which it is very difficult to calculate water flow rates. |
||
|
4. Slutsatser Resultatet av de två beskrivna fyllnadsförloppen skiljer sig inte särskilt mycket åt. Under arbetet med dessa fyllnadsförlopp har dock ett flertal varianter beräknats. Resultatet mellan dessa olika varianter har i stort liknat varandra. Ett fyllnadsförlopp där de förliga förläggningsutrymmena på däck 0 och 1 vattenfylls i ett tidigare skede kan ge ett mer avvikande resultat. Det är också möjligt att vattenfyllnaden av maskinrummen i dessa beräkningar har antagits ske i en för stor omfattning i de tidiga stegen.
Vid jämförelse mellan här redovisade exempel och JAIC's slutrapport beträffande slagsida, trim och tidsförlopp kan konstateras både samstämmighet och vissa avvikelser. Beträffande tidsförloppen har förstudien ej sådan precision att exakta tidsförlopp kan anges. Förstudien har dessutom bara redovisat ett fåtal exempel. Beträffande tidsförloppen i de fyra exemplen redovisas tider från det att vatteninträngningen börjar på bildäck till det att fartyget roterar runt på ca 54 min, ca 37 min, ca 21 min resp. ca 14 min. Tiderna är översiktligt beräknade och bör endast användas som en indikation på tidsförloppet i stort. I JAIC's rapport anges som sammanfattande slutsats 35 min för detta förlopp. Där finns även vittnesuppgifter som indikerar kortare tid resp. längre tid. Beträffande sjunkförloppets utveckling avseende fartygets successivt ökande slagsida och trim uppvisas icke obetydlig samstämmighet. Bland annat visas i exempel 2 slagsida överstigande 90 grader i sjunkförloppets slutskede. |
4. Conclusions The result of the two described sequences of filling does not differ particularly much. During the work with these sequences of filling a number of variations has however been computed. The result between these different variations has generally been similar. A sequence of filling where the forward passenger compartments on decks 0 and 1 are water filled at an early stage may result in a more dissimilar result. It is also possible that the flooding of the engine compartments in these calculations have been assumed to take place with too big emphasis on the early stages. Comparing the here presented examples with the JAIC Final report regarding angles of list, trims and times it can be concluded that there are both agreement and certain differences. Regarding the time sequences the pre-study does not have the precision so that exact times can be given. In addition the pre-study has only presented a few examples. Regarding the time sequences in the four examples times are given from water inflow starts on the car deck until the ship turns turtle after about 54 minutes, about 37 minutes, about 21 minutes respectively about 14 minutes. The times are superficially calculated and should only be used as an indication of the time sequence in general. In the JAIC Final report is given as concluding conclusion 35 minutes of this sequence. There are also testimonies indicating a shorter time respectively a longer time. Regarding the development of the events of sinking concerning the gradual increasing list and trim of the vessel, a not unimportant agreement is shown. Among other things is shown in Example 2 angle of list in excess of 90 degrees in the final of the sequence of sinking. |
||
|
Gruppen konstaterar att i redovisade exempel utvecklas Estonia sjunkförlopp i stort på det sätt som beskrivs i JAIC's slutrapport. Den avgörande skillnaden mellan JAIC's rapport och denna rapport ligger i att arbetsgruppen har visat på en naturlig väg för vattnet att nå däck 1 och 0 (maskinområdet mm) via bordvarts liggande ventilationskanaler när slagsidan överstiger ca 40 gr. Detta ger en rimlig förklaring till att Estonia kunde sjunka såsom det redovisats i haverirapporten. För vissa utrymmen kan vi dock inte i detalj redovisa hur vatten trängt in vilket vore önskvärt eftersom det påverkar sjunkförloppet.
I haverirapporten finns också vittnesmål om vatteninträngning i olika utrymmen, slagsida mm som både stämmer med och avviker från vad som kan utläsas av redovisade exempel. Arbetsgruppen har inte haft möjlighet att i detalj studera alla sådana uppgifter och ställa dessa i relation till vad som framkommit i redovisade exempel. Precisionen i våra beräkningar är inte av sådan art. Vi är naturligtvis beredda att delta i ett kunskapsutbyte syftande till att finna förklaringar till ev. avvikelser mellan här redovisade förlopp och av vittnen upplevda händelser. Andra scenarios avseende hur vatten kan nå de undre däcken är naturligtvis möjliga. Om av oss nyttjat ritningsunderlag inte återspeglar fartygets aktuella status gäller naturligtvis inte heller slutsatserna. |
The group concludes that in the shown examples the sequence of the sinking of the Estonia is developed generally in the manner as described in the Final report of the JAIC. The decisive difference between the JAIC report and this report is that the working group has shown a natural way for water to reach decks 1 and 0 (the engine compartments) through ventilation ducts located in the ship's sides, when the angle of list exceeds about 40 degrees. It gives a reasonable explanation why the Estonia could sink as described in the Final report. For certain compartments we cannot in detail describe how water entered, which would be wished for as it affects the sequence of sinking. In the Final report there are also testimonies about water ingress in different compartments, angle of list, etc., which both agree and disagree with what can be found in the given examples. The work group has not had the possibility to study in detail all such information and put these in relation to the findings of the given examples. The precision of our calculations is not of such kind. We are of course prepared to participate in an exchange of knowledge in order to explain the differences between here shown sequences and of events experienced by witnesses. Other scenarios regarding how water can reach the lower decks are of course possible. If by us used drawings do not reflect the actual status of the vessel, evidently the conclusions are not valid. |
||
|
5. Rekommendationer Vill man fördjupa sjunkförloppsstudien utöver vad som här presenterats är det gruppens uppfattning att det erfordras ytterligare underlag för att få erforderlig precision i en sådan studie. Förutom tillgång till ett komplett ritningsunderlag bör också kontrolleras bordvarts liggande ventilationstrummorna, status på vattentäta avdelningarna under bildäck, branddörrarna på bildäck samt fönster/ventiler och dörrar till däck 4-8 på styrbordssidan. Det är gruppens uppfattning att det är först efter att detta klarlagts som man kan uppnå en högre säkerhet i studieutfallet jämfört med vad som här presenterats. Om man skall göra en mer detaljerad studie av MV Estonias sjunkförlopp följer här ett par förslag på intressanta områden: · De fyllnadsförlopp som använts i den här studien kan vidareutvecklas. Ett sätt att göra detta är att bättre beskriva de vägar vattnet kan tänkas ha fyllt fartyget. För detta behövs dock väsentligt bättre ritningsunderlag. Fler alternativa sjunkförlopp bör i en fortsatt studie studeras närmare. Särskilt bör vattenfyllnad av de förliga förläggningsutrymmena i ett tidigare skede beaktas. · Fartygets dynamiska uppträdande då det fylls med vatten bör studeras närmare. · Beräkningen av fyllnadstiden kan förbättras väsentligt. Både vattenfyllnad av bildäck samt vattenfyllnad genom flödesöppningar bör beräknas mer noggrant och baseras på fartygets kurs, fart och rörelser.
· Ett prov eller en beräkning av rutornas hållfasthet skulle öka kunskapen om vatteninträngningen i fartyget. · Mot bakgrund av ventilationssystemets betydelse för sjunkförloppet och att vissa ventilationskanaler terminerar i skrovsidan bör denna säkerhetsaspekt analyseras. Gruppen har dock inte analyserat huruvida detta är förekommande på de färjor som idag är i bruk. Därutöver bör sjunkförloppet visualiseras i en animerad videosekvens. Frank Rosenius Staffan Sjöling |
5. Recommendations If you want to enlarge the study of the sequence of sinking as presented here, it is the opinion of the group that more basic information is required to achieve required precision of such study. Apart from access to a complete set of drawings, you should check the ventilation ducts in the ship's side, the status of the watertight compartments below the car deck, the fire doors on the car deck and the windows/portholes and doors on decks 4-8 starboard side. It is the opinion of the group that it is first after all this has been clarified that you can achieve a higher reliability of the result of the study compared with what has been shown here. If you shall do a more detailed study of the sequence of sinking of the MV Estonia below follows some proposals of interesting areas: · The sequences of filling used in this study can be further developed. One way to do so is to better describe the ways water may have filled the ship. However for this better drawings are required. More alternative sequences of sinking should be studied in a continued study. In particular the flooding of forward passenger compartments at an early stage should be considered. · The dynamic performance of the ship being filled with water should be studied more closely. · The calculation of filling times can be improved considerably. Both flooding of the car deck and water inflow through inflow openings should be computed more carefully based on ship's heading, speed and movements. · A test or a calculation of the strength of the windowpanes should increase the knowledge of water inflow into the ship. · With regard to the importance of the ventilation system on the sequence of sinking and that certain vent ducts end at the hull side this safety aspect should be analysed. The group has however not analysed if it is common practice on ferries used today. In addition the sequence of sinking should be visualized in an animated video sequence. Frank Rosenius Staffan Sjöling |
||
|
Referenser 1. Slutrapport, Ro-ro passagerarfärjan MS ESTONIAs förlisning i Östersjön den 28 september 1994, Svensk översättning, Den för Estland, Finland och Sverige gemensamma haverikommissionen, december 1997 2. MV ESTONIA accident investigation, Stability Calculations with water on the tank deck, Research Report VAL313-7331, 27 November 1997. 3. MV ESTONIA accident investigation, Stability Calculations, Technical Report VALC177, May 1996. 4. Ritning 590 02/21 Safety and Fire fighting equipment 5. Ritning 590 64/1 Ventilationplan, Blatt 1 6. Ritning 590 24/1 Wagendeckausrüstung 7. MV ESTONIA accident investigation, Numerical prediction of the water inflow to the car deck, Technical report VALC 174, February 1996 8. MV ESTONIA Accident Investigation, Internal Report, 1995-1997, Simulation of the capsize, supplement 522 |
References 1. Slutrapport, Ro-ro passagerarfärjan MS ESTONIAs förlisning i Östersjön den 28 september 1994, Svensk översättning, Den för Estland, Finland och Sverige gemensamma haverikommissionen, december 1997 2. MV ESTONIA accident investigation, Stability Calculations with water on the tank deck, Research Report VAL313-7331, 27 November 1997. 3. MV ESTONIA accident investigation, Stability Calculations, Technical Report VALC177, May 1996. 4. Drawing 590 02/21 Safety and Fire fighting equipment 5. Drawing 590 64/1 Ventilationplan, Blatt 1 6. Drawing 590 24/1 Wagendeckausrüstung 7. MV ESTONIA accident investigation, Numerical prediction of the water inflow to the car deck, Technical report VALC 174, February 1996 8. MV ESTONIA Accident Investigation, Internal Report, 1995-1997, Simulation of the capsize, supplement 522 |
||
|
Bilaga 1 Händelser och tider som har koppling till sjunkförloppet enl. haverirapporten. Bilaga 2 Fartygsmodellens utsträckning Bilaga 3 Flödesöppningar Bilaga 4 Lastkondition L2 Bilaga 5 Lastfall med vatten på bildäck, C0-C31
Bilaga 6 Fyllnadsförlopp Exempel 1, DX7F
Bilaga 8 GZ-kurvor Exempel 1, DX7F Bilaga 9 Fyllnadsförlopp Exempel 2, DX7W Bilaga 10 Flytlägen Exempel 2, DX7W Bilaga 11 GZ-kurvor Exempel 2, DX7W Bilaga 12 Tidsuppskattning för Exempel 1, 300T/min. Bilaga 13 Tidsuppskattning för Exempel 1, 1800T/min. Bilaga 14 Tidsuppskattning för Exempel 2, 300T/min. Bilaga 15 Tidsuppskattning för Exempel 2, 1800T/min. |
Attachment 1 Events and times relevant to the sequence of sinking as per the Final report. Attachment 2 Extent of the ship model Attachment 3 Inflow opening Attachment 4 Load condition L2 Attachment 5 Load condition with water on the car deck, C0-C31 Attachment 6 Sequence of filling, Example 1, DX7F Attachment 7 Float positions Example 1, DX7F Attachment 8 GZ-curves Example 1, DX7F Attachment 9 Sequence of filling, Example 2, DX7W Attachment 10 Float positions Example 2, DX7W Attachment 11 GZ- curves Example 2, DX7W Attachment 12 Time estimates of Example 1, 300T/min. Attachment 13 Time estimates of Example 1, 1800T/min. Attachment 14 Time estimates of Example 2, 300T/min. Attachment 15 Time estimates of Example 2, 1800T/min. |
|
Bilaga 1 |
Attachment 1 |
|
|
Vam Frank Rosenius Civ.ing. Staffan Sjöling SPF/Refgrp Estonia 2003-03-28 Bilaga 1 Händelser och tider som har koppling till sjunkförloppet enl. haverirapporten. Nedan redovisade händelser är en sammanställning av haverirapportens slutsatser och utgör arbetsgruppens referenser mot vilka förstudiens resultat avseende sjunkförloppet kommer att bedömas. Aktiviteterna redovisas i kronologisk ordning och med källhänvisning till [1]. - - - Vatten in längs rampens sidor. 13.2.6 0115 Bogvisiret lossnar. 13.2.5 0110-0115 Vattentäta dörrar* stängs. 13.2.6 0115+ ngr min Krängningen om 15 gr stabiliseras tillfälligt 13.2.6 0116-0120 Estonia ändrar kurs. Farten reduceras. Fig. 13.2 0120 Huvudmotorer stannar. 13.2.6 0124 40 gr slagsida Fig. 13.2/13.2.6 0125 Huvudgenerator stannar 13.2.6 0125 (ca) Fönstren på däck 4 krossas av vågorna 13.6
0130 (ca) 80 gr slagsida 13.2.6 0131-0132 Bryggan vattenfylld 13.2.6 0150 Ftg under vattenytan 13.2.6
|
Vam Frank Rosenius Civ.ing. Staffan Sjöling SPF/Refgrp Estonia 2003-03-28 Attachment 1 Events and times, which have connections to the sequence of sinking according to the Final report. Below reported events is a summary of the conclusions of the Final report and constitutes the references against which the result of the pre-study of the sequence of sinking will be judged. The activities are listed in chronological order with reference to [1]. - - - Water along the sides of the ramp. 13.2.6 0115 The bow visor falls off. 13.2.5 0110-0115 Watertight doors* are closed. 13.2.6 0115+ some minutes. List to 15 degrees temporarily stabilized 13.2.6 0116-0120 Estonia changes course. Speed is reduced. Fig. 13.2 0120 Main engines stops. 13.2.6 0124 40 degrees list. Fig. 13.2/13.2.6 0125 Main generators stop 13.2.6 0125 (about) Windows on deck 4 are smashed by the waves 13.6 0130 (about) 80 degrees list 13.2.6 0131-0132 The bridge is flooded 13.2.6 0150 Ship below water surface 13.2.6
|
|
|
Andra intressanta uppgifter i haverirapporten men som av kommissionen ej tagits med i slutsatserna:
2235 Vatten på bildäck in genom ventilationstrumma. Normalt. Ref 6.2.2 0110-0114 Slag i skrovet. 6.2.3 0110-0115 Vatten in längs rampens sidor 13.2.6 0115 Vatten in från bogen i väldig mängd (3.M) 6.2.3 0115 Farten reduceras. Vattentäta dörrar* stängs. 15 gr slagsida. 6.2.4 0117-0118 10-15 gr slagsida (3.M) 6.2.3
0115-0120 Däck 4, SB förliga trappa. Vatten ovanifrån. Tiden osäker. 6.3.3 0115-0120 Däck 1, centralt belägen hytt. Vatten ovanifrån. Tiden osäker. 6.3.2 0116-0120 Krängningen stabiliseras tillfälligt 20 - 30 gr 13.2.6 0121 Första Mayday 7.3.2 0124 Vakthavande matros i flotte. 90 gr slagsida 6.2.2 0125 20- 30 gr slagsida (radio-meddelande) 7.3.2 0125 Vakthavande matros: Botten upp, ftg sjönk 6.2.2 0125 Lasten förskjuts 1 m åt SB 6.2.4 0130(ca) 40-45 gr slagsida / 3.M 6.2.3 0130(ca) Alla vattentäta dörrar* stängda 6.2.3 0130(ca) Aktern under vattnet upp till stab.fenan. 90 gr slagsida. 6.2.1 (*Notera hur vattentäta dörrar stängs 0115 dels före slagsidan, dels efter slagsidan och de skulle vara stängda 0130) |
Other interesting information of the Final report, which the commission has not included in the conclusions: 2235 Water enters into the car deck through ventilation duct. Normal. Ref 6.2.2 0110-0114 Impacts on the hull. 6.2.3 0110-0115 Water enters along the sides of the ramp 13.2.6 0115 Water inflow from bow in large amount (3rd Eng) 6.2.3 0115 Speed is reduced. Watertight doors* are closed. 15 degrees list. 6.2.4 0117-0118 10-15 degrees list (3rd Eng) 6.2.3 0115-0120 Deck 4, starboard forward stairwell. Water from above. Time uncertain. 6.3.3 0115-0120 Deck 1, centrally located cabin. Water from above. Time uncertain. 6.3.2 0116-0120 The list was temporarily stabilized 20-30 degrees. 13.2.6 0121 First Mayday 7.3.2 0124 Watch keeping AB in raft. 90 degrees list 6.2.2 0125 20-30 degrees list (radio message) 7.3.2 0125 Watch keeping AB: Bottom up, ship sank 6.2.2 0125 Cargo shift 1 m to starboard 6.2.4 0130 (about) 40-45 degree list /3rd Eng 6.2.3 0130 (about) All watertight doors* closed 6.2.3 0130 (about) Stern below water until the stabilizer fin. 90 degrees list. 6.2.1
|
|
|
I haverirapporten övriga angivna data/värden som har betydelse för sjunkförloppet. Inflöde på bildäck efter att visiret lossnat: 300 - 1800 ton/min 12.6.2 Efter några få minuter ger detta 20 gr slagsida 12.6.2 Tid till att vatten når fönster på däck 4: 5 - 15 min 12.6.2 400 ton ger 10 gr slagsida 12.6.1 1 000 ton ger 20 gr slagsida 12.6.1 Gir ökar slagsidan med ca 3 gr 12.6.1 2 000 ton på bildäck ger 35 gr slagsida 12.6.1 Vatten från bildäck via branddörrar (noteras vid utrymning, ej tidigare) 13.2.6 När 2 000 ton vatten kommit in på bildäck når vågorna aktra fönstren på däck 4 12.6.1 /fig 12.14 Däck 5´s fönster under vatten vid 50 gr slagsida 13.6 Med 18 000 ton vatten på bildäck + däck 4 - 5, ger 75 gr slagsida 13.6 |
In the Final report other given information/values relevant to the sequence of sinking. Inflow on car deck after loss of visor: 300-1800 ton/min 12.6.2 After a few minutes this results in 20 degrees list 12.6.2 Time until water reaches windows on deck 4: 5 -15 minutes 12.6. 400 tons makes 10 degrees list 12.6.1 1 000 tons makes 20 degrees list 12.6.1 Turning increases list with about 3 degrees 12.6.1 2 000 tons on car deck makes 35 degrees list 12.6.1 Water from car deck via fire doors (observed during evacuation, not before) 13.2.6 When 2 000 tons of water has entered the car deck, the waves reach aft windows on deck 4. 12.6.1/fig 12.14 Deck 5 windows below water at 50 degrees list 13.6 With 18 000 ton water on the car deck + decks 4-5, result is 75 degrees list 13.6
|
|
Bilaga 4 |
Attachment 4 |
|
Lastkondition L2 Den lastkondition som använts i dessa beräkningar är hämtad från [1], Loading Condition K.0, Departure from Tallinn. Lastkonditionen är korrigerad för visirets vikt om -59 ton x=138.3 z=10.62. Uppgifter för visirets vikt och tyngdpunkt är hämtade från [2]. Lastfall K.0 har inte kunnat återskapas helt enligt tidigare beräkningar. Medeldjupgåendet skiljer -4 mm, trimmet -8 mm och metacenterhöjden + 20 mm. Skillnaden kan delvis bero på att modellens beräkningssektioner för olika rum skapas på nytt varje gång ett fartyg modelleras samt att olika metoder för att räkna inverkan av fria vätskeytor kan ha använts. Denna skillnad bedöms dock ha relativt liten inverkan på resultatet av beräkningarna med beaktande av de stora vattenvolymer som används i beräkningarna för fyllnadsförloppet. Den lastkondition fartyget hade då visiret lossnade kallas L2. |
Loading condition L2 The load condition used in these calculations are taken from [1], Loading Condition K.0, Departure from Tallinn. The load condition is corrected for the visor weight of -59 ton x=138.3 z=10.62. The information of visor weight and position is taken from [2]. Loading condition K.0 has not be re-created completely according earlier calculations. Mean draft differs -4 mm, trim -8 mm and meta centre height + 20 mm. The differences may partly be due to the calculation sections of the models being renewed at every time the ship is modelled and that different methods to calculate influence of free water surfaces may have been used. This difference is judged to have a fairly small influence of the result of the calculations in view of the large water volumes being used for the sequence of filling. The loading condition the ship had when the visor fell off is called L2. Main data for load condition L2 is: |
|
Deplacement/Displacement |
11 902.4 ton |
|
LCG |
63.43 m fr. AP |
|
TCG |
-0.01 m BB |
|
Medeldjupg./Mean draft |
5.318 m |
|
Djupg.akter/Draft aft |
5.648 m |
|
Djupg.för/Draft fwd |
4.988 m |
|
Trim |
-0.660 m |
|
KM |
11.97 m |
|
KG |
10.65 m |
|
GM0 |
1.32 m |
|
GMcorr. |
-0.07 m |
|
GM |
1.25 m |
|
Slagsida SB/List |
0.2 grader/degrees |
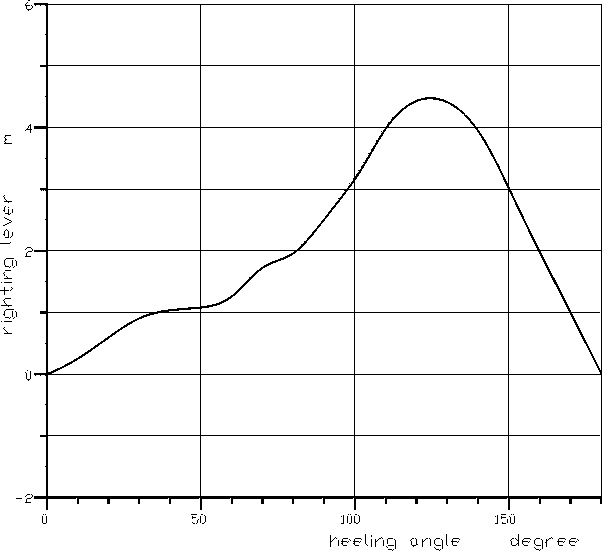
Figur 1. GZ-kurva för lastfall L2 - Figure 1. GZ-curve for loading condition L2
Anmärkning av
Björkman om Figur 1. GZ-kurvan ovan är ej
korrekt - den förutsätter att bl.a. hela
däckshuset är 100% vattentätt,
vilket inte är troligt. Beräkningarna
följer ej normala förutsättningar -
kurvan är 100% fel. Riktig GZ-kurva är
markerad STH nedan, dvs den kurva som gäller
för ett oskadat fartyg innan vatten lastas i
överbyggnaden. Remark by Björkman about
Figure 1. The GZ-curve above is not correct - it is
assumed that, e.g. the whole deckhouse is 100%
watertight, which is not probable or normal
practice when doing said calculations. The curve is
100% wrong. The correct GZ-curve for the intact
vessel prior loading water in the superstructure is
marked STH below.
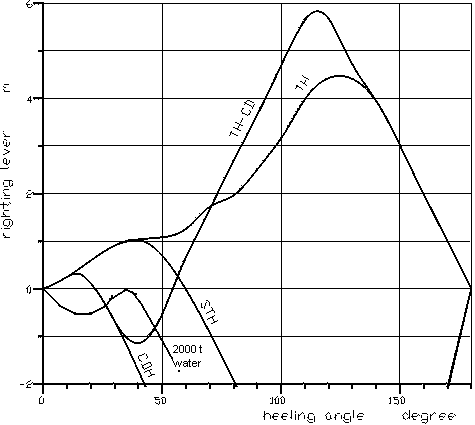
Figur 2. Lastkondition L2 med olika skrovutsträckning - Figure 2. Loading condition L2 with different hull extensions
|
Figur 2 visar MV Estonias GZ-kurva beräknad för ett och samma lastfall, L2, men för olika skrovutsträckning. Kurvan märkt STH är den GZ-kurva som fartyget får då det beräknas enligt de regler som gäller då man skall beräkna fartygets intaktstabilitetsegenskaper. Den kurvan är beräknad med en deplacerande kropp som sträcker sig i höjdled upp till överkant av bildäcket. Med ett deplacerande skrov med en utsträckning som STH ger beräkningarna en GZ-kurva för lastfall L2 med ett GZmax på ca 1 m och en stabilitetsvidd om ca 60 grader.
Kurvan märkt TH är den GZ-kurva som erhålls då man räknar in hela fartygets inneslutna volym (ovan bildäck) som deplacerande. Men i och med att de delar av fartyget som ligger över bildäck inte är vädertätt tillslutna får man inte räkna in en så stor del som bidragande till fartyget stabilitet. Med ett deplacerande skrov med en utsträckning som TH ger beräkningarna en GZ-kurva för lastfall L2 med ett GZmax på 4.43 m och en stabilitetsvidd om 180 grader.
Kurvan märkt CDH är den GZ-kurva som erhålls då endast de delar av skrovet som ligger under bildäck räknas som deplacerande. Det är de delar som är tillåtna att räkna med som deplacerande då fartygets läckstabilitet skall beräknas. Denna del sträcker sig inte längre än till bildäck eftersom skrovet över bildäck saknar vattentät indelning. Med ett deplacerande skrov med en utsträckning som CDH ger beräkningarna en GZ-kurva för lastfall L2 med ett GZmax på 0.32 m och en stabilitetsvidd om ca 22 grader.
Den sista kurvan märkt TH-CD är den GZ-kurva som erhålls då man räknar hela fartygets skrov förutom bildäck- däck 2 och däck 3- som deplacerande. Denna kurva har samma utseende som den märkt CDH fram till en krängningsvinkel om ca 30 grader. Efter denna krängningsvinkel kommer de delar av fartyget som ligger över bildäck att bidraga till det rätande momentet och förhindra den kapsejsning fartyget skulle erfarit om det krängdes till en vinkel över 22 grader med enbart skrov CDH som deplacerande. Med ett deplacerande skrov med en utsträckning som TH-CD ger beräkningarna en GZ-kurva för lastfall L2 med ett GZmax på 5.67 m och en stabilitetsvidd där fartyget är stabilt fram till en krängningsvinkel på ca 22 grader. Efter 22 graders krängningsvinkel kränger fartyget ytterligare fram till 55 grader där däckshuset över bildäck motverkar ytterligare krängning.
Den sista kurvan representerar ett fall där hela bildäck står i öppen kommunikation med havsvattnet. Fartyget skulle ha ett stabilt upprätt läge, men efter ett initialt krängande moment som får fartyget att kränga förbi 22 grader skulle det finna ett nytt stabilt jämviktsläge vid 55 graders krängning. Fartyget skulle förbli flytande i detta läge så länge vatten inte kunde ta sig in i övriga delar av fartyget. Detta fall kan liknas vid, men inte representera, det som hände under Estonias sista resa.
|
Figure 2 shows the MV Estonia GZ-curve for one and the same loading condition, L2, but for different extents (sic) of the hull. The curve marked STH is the GZ-curve obtained, when it is calculated according to the rules valid, when you calculate the intact stability particulars of the ship. That curve is computed using a displacing body with a vertical extent up to the upper edge of the car deck. With a displacing hull with an extent as STH the calculations gives a GZ-curve for loading condition L2 with a Gzmax of about 1 m and a stability range of about 60 degrees.
The curve marked TH is the GZ-curve obtained when you include the whole enveloped volume of the ship (above the superstructure) as displacing. But in view of the fact that those parts located above the car deck are not locked weather tight, you are not allowed to calculate with such a large part as contributing to the ship's stability. With a displacing hull with an extent as TH the calculations produce a GZ-curve for loading condition L2 with a Gzmax of 4.43 m and a stability range of 180 degrees.
The curve marked CDH is the GZ curve resulting when only the parts of the hull located below the car deck are assumed to be displacing. It is the parts, which are permitted to be included in the calculations when the ship's damage stability shall be computed. With a displacing hull with an extent as CDH the calculations make a GZ-curve for loading condition L2 with a Gamax of 0.32 m and a stability range of about 22 degrees.
The last curve TH-CD is the GZ-curve obtained when you calculate the whole ship's hull except the car deck- deck 2 and deck 3- as displacing. This curve has the same form as the one marked CDH up to an angle of list of about 30 degrees. Above this angle the parts of the ship above the car deck contribute to the righting moment and prevent the capsizing the ship should suffer if it was heeled to an angle above 22 degrees with only hull CDH as displacing. With a displacing hull with an extent as TH-CD the calculations make a GZ-curve for loading condition L2 with a Gzmax of 5.67 m and a stability range where the ship is stable up to an angle of list of about 22 degrees. After 22 degrees angle of list the ship lists more up to 55 degrees, where the deckhouse above the car deck prevents further heeling.
The last curve represents a case where the whole car deck is in open communication with the seawater. The ship should have a stable upright condition, but after an initial heeling moment that makes the ship lists more than 22 degrees, there should be a new stable equilibrium at 55 degrees list. The ship should remain floating in this condition as long as water could not enter other parts of the ship. This case can be similar with but cannot represent, what happened during the last voyage of the Estonia.
|
|
Anmärkning av Björkman om Figur 2 ovan. Hydrostatiska och stabilitets (GZ) kurvor skall normalt göras baserade på konstruktionstrim. Beräkningarna skall inkludera volumen upp till översta ytan på däcksbeläggningen.
Däckshus på däck ovan fribordsdäcket (däck 5, 6, 7 och 8) får ej tas med i beräkningarna, även om öppningar i dem anses vara stängda. Metoder att stänga och upprätthålla vädertäthet skall vara enligt Myndighetens bedömning. Metoderna skall försäkra att täthet kan upprätthållas i alla väderfall, och i detta syfte skall täthetsprov utföras vid första besikting och kan krävas vid periodisk besiktning och årlig besiktning eller mera frekvent. Vad beträffar Estonia kan ingen öppning över däck 3 anses vara vädertät.
Om överbyggnaden (däck 2 och 3) och däckshuset på däck 4 inte kan anses vara instängda (täta) kan emellertid de tas med i beräkningarna av stabilitet (GZ kurva) upp till den vinkel då dess öppningar kommer under vatten - den öppna bogrampen för överbyggnaden (däck 2 och 3) och sidofönsterna för däckshuset på däck 4. Vid denna vinkel skall den statiska stabilitetskruvan uppvisa ett eller flera steg, och vid beräkning av stabilitet vid högre vinklar skall de vattenfyllda utrymmena (överbyggnad och däckshus däck 4) anses icke existera. I fall då fartyget sjunker eller kapsejsar när inflöde sker enom en öppning, skall stabilitetskurvan sluta vid den krängvinkeln och fartyget skall anses ha förlorat sin stabilitet (kapsejsat). Helt klart kapsejsar Estonia efter inflöde genom förrampsöppningen redan vid en krängvinkel vid cirka 40 grader (omkring 2 000 ton vatten inne i överbyggnaden). Enligt ovan bör det vara helt klart att däck 4-8 aldrig kan inkluderas i några GZ-kurvor för Estonia. GZ-kurvorna i Förstudien är inte alls representativa. Amiral Rosenius och experten Sjöling kan inte vara okunniga om ovan grundläggande uppgifter hur man beräknar GZ-kurvor och stabilitet. |
Comment by Björkman on Figure 2 above: Hydrostatic and stability (GZ) curves should normally be prepared on a designed trim basis. The calculations should take into account the volume to the upper surface of the deck sheathing. Enclosed superstructures (i.e. decks 2 and 3 for the Estonia) complying with the 1966 Load Line Convention may be taken into account for the GZ-curve as long as the forward ramp/door on deck 2 is considered weather tight. If the bow ramp/door is open - as suggested by the JAIC - permitting water to enter, it is doubtful, if the flooded superstructure can be considered enclosed and if it contributes to the stability (but see below). Deckhouses on the freeboard deck (deck 4 for the Estonia) may be taken into account, provided that they comply with the conditions for enclosed superstructures laid down in the 1966 Load Line Convention. This is not the case for the Estonia as the deckhouse on deck 4 has large windows in the side (but see below) and windows cannot be fitted in ends and sides of enclosed superstructures and in first tier deckhouses that are considered buoyant in the stability calculations (as per international safety rules). Windows are defined as being rectangular openings generally, having a radius at each corner relative to the window size in accordance with recognized national or international standards, and round or oval openings with an area exceeding 0.16 m2. All windows in the side of the Estonia had an area at least > 0.24 m2. Deckhouses on decks above the freeboard deck (i.e. decks 5, 6, 7 and 8) should not be taken into account, even if openings within them may be regarded as closed. The means for securing and maintaining weather tightness shall be to the satisfaction of the Administration. The arrangements shall ensure that the tightness can be maintained in any sea conditions, and for this purpose tests for tightness shall be required at the initial survey, and may be required at periodical surveys and at annual inspections or at more frequent intervals. For the Estonia no openings above deck 3 can be considered weather tight. The superstructure (decks 2 and 3) and the deckhouse on deck 4 not regarded as enclosed can, however, be taken into account in stability (GZ-curve) calculations up to the angle at which their openings are flooded - the open bow door for the superstructure (decks 2 and 3) and the windows for the deck 4 deckhouse. At this angle, the static stability curve should show one or more steps, and in subsequent computations the flooded space should be considered non-existent. In cases where the ship would sink or capsize due to flooding through any openings, the stability curve should be cut short at the corresponding angle of flooding and the ship should be considered to have entirely lost her stability (capsized). Evidently the Estonia capsizes after having been flooded throught the bow opening at an angle of heel of about 40 degrees (about 2 000 tons water inside the superstructure). From above it should be clear that decks 4-8 could never be included in any GZ-curves for the Estonia. The GZ-curves used in the Pre-study are not representative at all. Admiral Rosenius and expert Sjöling cannot be ignorant about above basic facts to compute GZ-curves and stability. |
|
Bilaga 5 |
Attachment 5 |
|
Lastfall med vatten på bildäck, C0-C31 Utifrån lastkondition L2 har fartygets stabilitet beräknats för en ökande mängd vatten på bildäck. Lastfall L2 har beräknats med en vattenmängd från 0 till 12 000 ton på bildäck. Dessa lastfall kallas C0-C31. I dessa beräkningar har hela fartygsvolymen ansatts som bidragande till det rätande momentet. Inget inflöde av vatten i fartygets övriga struktur har beaktats. Fartygets slagsida ökar markant med vatten på bildäck upp till en mängd av ca 3 000 ton. Vid ca 5 000 ton stagnerar slagsidan för att sedan minska vid större mängd vatten än 8 000 ton på bildäck. Denna minskning av slagsida har inte analyserats närmare men kan bero på att förskjutningen av sidotyngdpunkten avstannar. Med en vattenmängd av ca 5 500 ton på bildäck når vattenytan dörrarna på bildäckets centercasing. |
Loading condition with water on the car deck, C0-C31 Starting with loading condition L2 the ship's stability has been computed with different amounts of water on the car deck. Loading condition L2 is computed with an amount of water from 0 to 12 000 tons on the car deck. These loading conditions are called C0-C31. In these calculations the total volume of the ship as considered contributing to the righting moment. No inflow of water into the other ship's structure has been considered. The heel of the ship increases considerably with water on the car deck up to an amount of about 3 000 tons. At 5 000 tons the angle of lists stagnate to be reduced with amounts exceeding 8 000 tons on the car deck. This reduction has not been analysed closer but may be the result of the shift of the transverse centre of gravity being arrested. With an amount of water of about 5 500 tons on the car deck, the water surface reaches the doors in the car deck centre casing. |
|
Loading condition Lastfall |
Water on car deck/ Vatten på bildäck (ton) |
T - mean draft medel-djupg. (m) |
Trim (m) |
Heel (degree) slagsida (grader) |
TA - aft draft djupg. akter (m) |
TF - fwd draft djupg. för (m) |
KG (m) |
GM (m)** |
GMc (m)** |
|
C0 |
0 |
5.318 |
-0.66 |
-0.2 |
5.648 |
4.988 |
10.65 |
1.25 |
-0.07 |
|
C1 |
200 |
5.295 |
-0.619* |
-6.7 |
5.605 |
4.986 |
10.6 |
-10.71 |
-12.12 |
|
C2 |
400 |
5.207 |
-0.395* |
-11.7 |
5.404 |
5.009 |
10.56 |
-10.45 |
-11.93 |
|
C3 |
600 |
5.086 |
-0.118* |
-16 |
5.144 |
5.027 |
10.51 |
-10.19 |
-11.75 |
|
C4 |
800 |
4.95 |
-0.124* |
-19.7 |
5.013 |
4.888 |
10.47 |
-9.93 |
-11.57 |
|
C5 |
1000 |
4.786 |
0.071* |
-23.2 |
4.75 |
4.821 |
10.43 |
-9.67 |
-11.4 |
|
C6 |
1300 |
4.515 |
0.115* |
-28 |
4.458 |
4.572 |
10.38 |
-9.31 |
-11.15 |
|
C7 |
1600 |
4.138 |
0.24* |
-32.6 |
4.018 |
4.258 |
10.3 |
-8.97 |
-10.91 |
|
C8 |
1900 |
3.71 |
0.287* |
-37 |
3.567 |
3.853 |
10.28 |
-8.67 |
-10.68 |
|
C9 |
2100 |
3.406 |
0.312 |
-40.3 |
3.25 |
3.562 |
10.25 |
-8.48 |
-10.54 |
|
C10 |
2400 |
2.861 |
0.33 |
-44.5 |
2.696 |
3.026 |
10.21 |
-8.21 |
-10.32 |
|
C11 |
2700 |
2.525 |
0.326 |
-47.4 |
2.362 |
2.688 |
10.18 |
-7.95 |
-10.12 |
|
C12 |
3000 |
2.279 |
0.313 |
-49.6 |
2.133 |
2.435 |
10.15 |
-7.67 |
-9.88 |
|
C13 |
3300 |
2.115 |
0.299 |
-51.1 |
1.965 |
2.264 |
10.12 |
-7.45 |
-9.7 |
|
C14 |
3600 |
2.058 |
0.275 |
-51.8 |
1.921 |
2.196 |
10.09 |
-7.23 |
-9.52 |
|
C15 |
3900 |
2.065 |
0.245 |
-52.3 |
1.942 |
2.187 |
10.07 |
-7.04 |
-9.34 |
|
C16 |
4500 |
2.022 |
0.194 |
-53.5 |
1.925 |
2.119 |
10.03 |
-6.69 |
-9.02 |
|
C17 |
5000 |
2.065 |
0.145 |
-54 |
1.992 |
2.137 |
10.01 |
-6.43 |
-8.76 |
|
C18 |
5500 |
2.177 |
0.089 |
-54.2 |
2.132 |
2.222 |
9.99 |
-6.19 |
-8.52 |
|
C19 |
6000 |
2.307 |
0.033 |
-54.3 |
2.291 |
2.323 |
9.98 |
-5.89 |
-8.3 |
|
C21 |
7000 |
2.579 |
-0.08 |
-54.4 |
2.619 |
2.253 |
9.97 |
-5.62 |
-7.88 |
|
C23 |
8000 |
3.018 |
-0.205 |
-53.6 |
3.121 |
2.915 |
9.98 |
-5.45 |
-7.51 |
|
C25 |
9000 |
3.65 |
-0.315 |
-51.8 |
3.808 |
3.492 |
10 |
-5.45 |
-7.32 |
|
C27 |
10000 |
4.313 |
-0.413 |
-49.8 |
4.52 |
4.107 |
10.04 |
-5.31 |
-7.02 |
|
C29 |
11000 |
4.97 |
-0.494 |
-47.3 |
5.217 |
4.723 |
10.09 |
-5.18 |
-6.74 |
|
C31 |
12000 |
5.7 |
-0.573 |
-44.4 |
5.987 |
5.414 |
10.15 |
-5.07 |
-6.49 |
Sammanfattning Del 1 Index